.bar
class: BarData
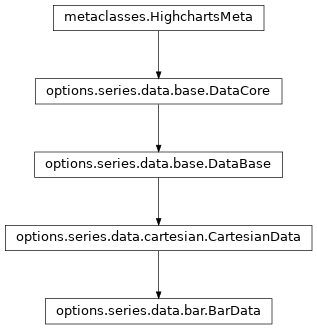
- class BarData(**kwargs)[source]
Variant of
CartesianDatawhich is used for data points in a column or bar graph context.Class Inheritance
- copy(other=None, overwrite=True, **kwargs)
Copy the configuration settings from this instance to the
otherinstance.- Parameters:
other (
HighchartsMeta) – The target instance to which the properties of this instance should be copied. IfNone, will create a new instance and populate it with properties copied fromself. Defaults toNone.overwrite (
bool) – ifTrue, properties inotherthat are already set will be overwritten by their counterparts inself. Defaults toTrue.kwargs – Additional keyword arguments. Some special descendents of
HighchartsMetamay have special implementations of this method which rely on additional keyword arguments.
- Returns:
A mutated version of
otherwith new property values
- classmethod from_array(value)
Creates a collection of data point instances, parsing the contents of
valueas an array (iterable). This method is specifically used to parse data that is input to Highcharts for Python without property names, in an array-organized structure as described in the Highcharts JS documentation.See also
The specific structure of the expected array is highly dependent on the type of data point that the series needs, which itself is dependent on the series type itself.
Please review the detailed series documentation for series type-specific details of relevant array structures.
Note
An example of how this works for a simple
LineSeries(which usesCartesianDatadata points) would be:my_series = LineSeries() # A simple array of numerical values which correspond to the Y value of the # data point my_series.data = [0, 5, 3, 5] # An array containing 2-member arrays (corresponding to the X and Y values # of the data point) my_series.data = [ [0, 0], [1, 5], [2, 3], [3, 5] ] # An array of dict with named values my_series.data = [ { 'x': 0, 'y': 0, 'name': 'Point1', 'color': '#00FF00' }, { 'x': 1, 'y': 5, 'name': 'Point2', 'color': '#CCC' }, { 'x': 2, 'y': 3, 'name': 'Point3', 'color': '#999' }, { 'x': 3, 'y': 5, 'name': 'Point4', 'color': '#000' } ]
- Parameters:
value (iterable) –
The value that should contain the data which will be converted into data point instances.
Note
If
valueis not an iterable, it will be converted into an iterable to be further de-serialized correctly.- Returns:
Collection of data point instances (descended from
DataBase)- Return type:
- classmethod from_dict(as_dict: dict, allow_snake_case: bool = True)
Construct an instance of the class from a
dictobject.
- classmethod from_js_literal(as_str_or_file, allow_snake_case: bool = True, _break_loop_on_failure: bool = False)
Return a Python object representation of a Highcharts JavaScript object literal.
- Parameters:
as_str_or_file (
str) – The JavaScript object literal, represented either as astror as a filename which contains the JS object literal.allow_snake_case (
bool) – IfTrue, interpretssnake_casekeys as equivalent tocamelCasekeys. Defaults toTrue._break_loop_on_failure (
bool) – IfTrue, will break any looping operations in the event of a failure. Otherwise, will attempt to repair the failure. Defaults toFalse.
- Returns:
A Python object representation of the Highcharts JavaScript object literal.
- Return type:
HighchartsMeta
- classmethod from_json(as_json_or_file, allow_snake_case: bool = True)
Construct an instance of the class from a JSON string.
- Parameters:
as_json_or_file – The JSON string for the object or the filename of a file that contains the JSON string.
allow_snake_case (
bool) – IfTrue, interpretssnake_casekeys as equivalent tocamelCasekeys. Defaults toTrue.
- Returns:
A Python objcet representation of
as_json.- Return type:
HighchartsMeta
- to_dict() dict
Generate a
dictrepresentation of the object compatible with the Highcharts JavaScript library.Note
The
dictrepresentation has a property structure and naming convention that is intentionally consistent with the Highcharts JavaScript library. This is not Pythonic, but it makes managing the interplay between the two languages much, much simpler.
- to_js_literal(filename=None, encoding='utf-8') str | None
Return the object represented as a
strcontaining the JavaScript object literal.
- to_json(filename=None, encoding='utf-8')
Generate a JSON string/byte string representation of the object compatible with the Highcharts JavaScript library.
Note
This method will either return a standard
stror abytesobject depending on the JSON serialization library you are using. For example, if your environment has orjson, the result will be abytesrepresentation of the string.- Parameters:
- Returns:
A JSON representation of the object compatible with the Highcharts library.
- Return type:
- static trim_dict(untrimmed: dict, to_json: bool = False) dict
Remove keys from
untrimmedwhose values areNoneand convert values that have.to_dict()methods.
- static trim_iterable(untrimmed, to_json=False)
Convert any
EnforcedNullTypevalues inuntrimmedto'null'.
- property accessibility: DataPointAccessibility | None
Accessibility options for a data point.
- Return type:
DataPointAccessibilityorNone
- property border_color: str | Gradient | Pattern | None
The color of the border surrounding each column or bar. Defaults to
None
- property border_width: int | float | Decimal | None
The width of the border surrounding each column or bar. Defaults to
None.- Return type:
numeric or
None
- property class_name: str | None
The additional CSS class name to apply to the data point’s graphical elements.
- property color: str | Gradient | Pattern | None
The color of the individual data point. Defaults to
None.
- property color_index: int | None
When operating in styled mode, a specific color index to use for the point, so its graphic representations are given the class name
highcharts-color-{n}. Defaults toNone.
- property custom: JavaScriptDict | None
A reserved subspace to store options and values for customized functionality.
Here you can add additional data for your own event callbacks and formatter callbacks.
- property dash_style: str | None
Name of the dash style to use for bar or column. Defaults to
None.Accepts one of the following values:
‘Dash’,
‘DashDot’,
‘Dot’,
‘LongDash’,
‘LongDashDot’,
‘LongDashDotDot’,
‘ShortDash’,
‘ShortDashDot’,
‘ShortDashDotDot’,
‘ShortDot’,
‘Solid’
- property data_labels: DataLabel | None
Individual data label for the data point.
- Return type:
DataLabelorNone
- property description: str | None
A description of the data point to add to the screen reader information about the data point.
- Return type:
- property drag_drop: DragDropOptions | None
The draggable-points module allows points to be moved around or modified in the chart.
In addition to the options mentioned under the dragDrop API structure, the module fires three (JavaScript) events:
point.dragStartpoint.dragpoint.drop
- Return type:
DragDropOptionsorNone
- property drilldown: str | None
The
idof a series in thedrilldown.seriesarray to use as a drilldown destination for this point. Defaults toNone.
- property events: PointEvents | None
Event handlers for individual data points.
- Return type:
PointEventsorNone
- property id: str | None
The id of the data point. Defaults to
None.Note
This can be used (in JavaScript) after render time to get a pointer to the point object through
chart.get().
- property label_rank: int | float | Decimal | None
The rank for this point’s data label in the case of collision. Defaults to
None.Note
If two data labels are about to overlap, the data label for the point with the highest
label_rankwill be shown.- Return type:
numeric or
None
- property marker: Marker | None
Options for the point markers of line-like series.
- Return type:
MarkerorNone
- property name: str | None
The name to display for the point in data labels, tooltips, in legends, etc. Defaults to
None.
- property point_width: int | float | Decimal | None
A pixel value specifying a fixed width for the column or bar. Defaults to
None.Note
If specified, overrides the
point_widthprovided for the series as a whole.Note
The
point_widthaffects the dimension that is not based on the point value.- Return type:
numeric or
None
- property selected: bool | None
If
True, indicates that the data point is initially selected. Defaults toNone, which behaves asFalse.
- property x: str | date | datetime | int | float | Decimal | None
The point’s location on the x-axis. Defaults to
None.If
None, the point’s position on the x-axis will be automatically determined based on its position in the series’dataarray. The first point will be given anxvalue of0, or the series’point_startvalue. Each subsequent point will be incremented either by1or the value ofpoint_interval.
class: WaterfallData
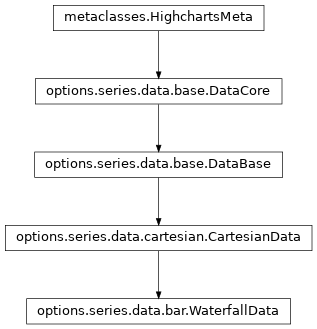
- class WaterfallData(**kwargs)[source]
Variant of
CartesianDatawhich is used for data points in a waterfall chart.Class Inheritance
- copy(other=None, overwrite=True, **kwargs)
Copy the configuration settings from this instance to the
otherinstance.- Parameters:
other (
HighchartsMeta) – The target instance to which the properties of this instance should be copied. IfNone, will create a new instance and populate it with properties copied fromself. Defaults toNone.overwrite (
bool) – ifTrue, properties inotherthat are already set will be overwritten by their counterparts inself. Defaults toTrue.kwargs – Additional keyword arguments. Some special descendents of
HighchartsMetamay have special implementations of this method which rely on additional keyword arguments.
- Returns:
A mutated version of
otherwith new property values
- classmethod from_array(value)
Creates a collection of data point instances, parsing the contents of
valueas an array (iterable). This method is specifically used to parse data that is input to Highcharts for Python without property names, in an array-organized structure as described in the Highcharts JS documentation.See also
The specific structure of the expected array is highly dependent on the type of data point that the series needs, which itself is dependent on the series type itself.
Please review the detailed series documentation for series type-specific details of relevant array structures.
Note
An example of how this works for a simple
LineSeries(which usesCartesianDatadata points) would be:my_series = LineSeries() # A simple array of numerical values which correspond to the Y value of the # data point my_series.data = [0, 5, 3, 5] # An array containing 2-member arrays (corresponding to the X and Y values # of the data point) my_series.data = [ [0, 0], [1, 5], [2, 3], [3, 5] ] # An array of dict with named values my_series.data = [ { 'x': 0, 'y': 0, 'name': 'Point1', 'color': '#00FF00' }, { 'x': 1, 'y': 5, 'name': 'Point2', 'color': '#CCC' }, { 'x': 2, 'y': 3, 'name': 'Point3', 'color': '#999' }, { 'x': 3, 'y': 5, 'name': 'Point4', 'color': '#000' } ]
- Parameters:
value (iterable) –
The value that should contain the data which will be converted into data point instances.
Note
If
valueis not an iterable, it will be converted into an iterable to be further de-serialized correctly.- Returns:
Collection of data point instances (descended from
DataBase)- Return type:
- classmethod from_dict(as_dict: dict, allow_snake_case: bool = True)
Construct an instance of the class from a
dictobject.
- classmethod from_js_literal(as_str_or_file, allow_snake_case: bool = True, _break_loop_on_failure: bool = False)
Return a Python object representation of a Highcharts JavaScript object literal.
- Parameters:
as_str_or_file (
str) – The JavaScript object literal, represented either as astror as a filename which contains the JS object literal.allow_snake_case (
bool) – IfTrue, interpretssnake_casekeys as equivalent tocamelCasekeys. Defaults toTrue._break_loop_on_failure (
bool) – IfTrue, will break any looping operations in the event of a failure. Otherwise, will attempt to repair the failure. Defaults toFalse.
- Returns:
A Python object representation of the Highcharts JavaScript object literal.
- Return type:
HighchartsMeta
- classmethod from_json(as_json_or_file, allow_snake_case: bool = True)
Construct an instance of the class from a JSON string.
- Parameters:
as_json_or_file – The JSON string for the object or the filename of a file that contains the JSON string.
allow_snake_case (
bool) – IfTrue, interpretssnake_casekeys as equivalent tocamelCasekeys. Defaults toTrue.
- Returns:
A Python objcet representation of
as_json.- Return type:
HighchartsMeta
- to_dict() dict
Generate a
dictrepresentation of the object compatible with the Highcharts JavaScript library.Note
The
dictrepresentation has a property structure and naming convention that is intentionally consistent with the Highcharts JavaScript library. This is not Pythonic, but it makes managing the interplay between the two languages much, much simpler.
- to_js_literal(filename=None, encoding='utf-8') str | None
Return the object represented as a
strcontaining the JavaScript object literal.
- to_json(filename=None, encoding='utf-8')
Generate a JSON string/byte string representation of the object compatible with the Highcharts JavaScript library.
Note
This method will either return a standard
stror abytesobject depending on the JSON serialization library you are using. For example, if your environment has orjson, the result will be abytesrepresentation of the string.- Parameters:
- Returns:
A JSON representation of the object compatible with the Highcharts library.
- Return type:
- static trim_dict(untrimmed: dict, to_json: bool = False) dict
Remove keys from
untrimmedwhose values areNoneand convert values that have.to_dict()methods.
- static trim_iterable(untrimmed, to_json=False)
Convert any
EnforcedNullTypevalues inuntrimmedto'null'.
- property accessibility: DataPointAccessibility | None
Accessibility options for a data point.
- Return type:
DataPointAccessibilityorNone
- property class_name: str | None
The additional CSS class name to apply to the data point’s graphical elements.
- property color: str | Gradient | Pattern | None
The color of the individual data point. Defaults to
None.
- property color_index: int | None
When operating in styled mode, a specific color index to use for the point, so its graphic representations are given the class name
highcharts-color-{n}. Defaults toNone.
- property custom: JavaScriptDict | None
A reserved subspace to store options and values for customized functionality.
Here you can add additional data for your own event callbacks and formatter callbacks.
- property data_labels: DataLabel | None
Individual data label for the data point.
- Return type:
DataLabelorNone
- property description: str | None
A description of the data point to add to the screen reader information about the data point.
- Return type:
- property drag_drop: DragDropOptions | None
The draggable-points module allows points to be moved around or modified in the chart.
In addition to the options mentioned under the dragDrop API structure, the module fires three (JavaScript) events:
point.dragStartpoint.dragpoint.drop
- Return type:
DragDropOptionsorNone
- property drilldown: str | None
The
idof a series in thedrilldown.seriesarray to use as a drilldown destination for this point. Defaults toNone.
- property events: PointEvents | None
Event handlers for individual data points.
- Return type:
PointEventsorNone
- property id: str | None
The id of the data point. Defaults to
None.Note
This can be used (in JavaScript) after render time to get a pointer to the point object through
chart.get().
- property is_intermediate_sum: bool | None
When
True, the point acts as a summary column for the values added or subtracted since the last intermediate sum, or since the start of the series. Defaults toNone, which is interpreted asFalse.Warning
The
yvalue is ignored.
- property is_sum: bool | None
When
True, the point displays the total sum across the entire series. Defaults toNone, which is interpreted asFalse.Warning
The
yvalue is ignored.
- property label_rank: int | float | Decimal | None
The rank for this point’s data label in the case of collision. Defaults to
None.Note
If two data labels are about to overlap, the data label for the point with the highest
label_rankwill be shown.- Return type:
numeric or
None
- property marker: Marker | None
Options for the point markers of line-like series.
- Return type:
MarkerorNone
- property name: str | None
The name to display for the point in data labels, tooltips, in legends, etc. Defaults to
None.
- property selected: bool | None
If
True, indicates that the data point is initially selected. Defaults toNone, which behaves asFalse.
- property x: str | date | datetime | int | float | Decimal | None
The point’s location on the x-axis. Defaults to
None.If
None, the point’s position on the x-axis will be automatically determined based on its position in the series’dataarray. The first point will be given anxvalue of0, or the series’point_startvalue. Each subsequent point will be incremented either by1or the value ofpoint_interval.
class: WindBarbData
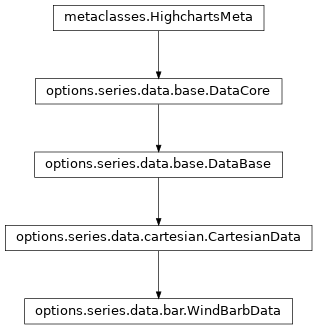
- class WindBarbData(**kwargs)[source]
Variant of
CartesianDatawhich is used for data points in a windbarb chart.Class Inheritance
- copy(other=None, overwrite=True, **kwargs)
Copy the configuration settings from this instance to the
otherinstance.- Parameters:
other (
HighchartsMeta) – The target instance to which the properties of this instance should be copied. IfNone, will create a new instance and populate it with properties copied fromself. Defaults toNone.overwrite (
bool) – ifTrue, properties inotherthat are already set will be overwritten by their counterparts inself. Defaults toTrue.kwargs – Additional keyword arguments. Some special descendents of
HighchartsMetamay have special implementations of this method which rely on additional keyword arguments.
- Returns:
A mutated version of
otherwith new property values
- classmethod from_array(value)[source]
Creates a collection of data point instances, parsing the contents of
valueas an array (iterable). This method is specifically used to parse data that is input to Highcharts for Python without property names, in an array-organized structure as described in the Highcharts JS documentation.See also
The specific structure of the expected array is highly dependent on the type of data point that the series needs, which itself is dependent on the series type itself.
Please review the detailed series documentation for series type-specific details of relevant array structures.
Note
An example of how this works for a simple
LineSeries(which usesCartesianDatadata points) would be:my_series = LineSeries() # A simple array of numerical values which correspond to the Y value of the # data point my_series.data = [0, 5, 3, 5] # An array containing 2-member arrays (corresponding to the X and Y values # of the data point) my_series.data = [ [0, 0], [1, 5], [2, 3], [3, 5] ] # An array of dict with named values my_series.data = [ { 'x': 0, 'y': 0, 'name': 'Point1', 'color': '#00FF00' }, { 'x': 1, 'y': 5, 'name': 'Point2', 'color': '#CCC' }, { 'x': 2, 'y': 3, 'name': 'Point3', 'color': '#999' }, { 'x': 3, 'y': 5, 'name': 'Point4', 'color': '#000' } ]
- Parameters:
value (iterable) –
The value that should contain the data which will be converted into data point instances.
Note
If
valueis not an iterable, it will be converted into an iterable to be further de-serialized correctly.- Returns:
Collection of data point instances (descended from
DataBase)- Return type:
- classmethod from_dict(as_dict: dict, allow_snake_case: bool = True)
Construct an instance of the class from a
dictobject.
- classmethod from_js_literal(as_str_or_file, allow_snake_case: bool = True, _break_loop_on_failure: bool = False)
Return a Python object representation of a Highcharts JavaScript object literal.
- Parameters:
as_str_or_file (
str) – The JavaScript object literal, represented either as astror as a filename which contains the JS object literal.allow_snake_case (
bool) – IfTrue, interpretssnake_casekeys as equivalent tocamelCasekeys. Defaults toTrue._break_loop_on_failure (
bool) – IfTrue, will break any looping operations in the event of a failure. Otherwise, will attempt to repair the failure. Defaults toFalse.
- Returns:
A Python object representation of the Highcharts JavaScript object literal.
- Return type:
HighchartsMeta
- classmethod from_json(as_json_or_file, allow_snake_case: bool = True)
Construct an instance of the class from a JSON string.
- Parameters:
as_json_or_file – The JSON string for the object or the filename of a file that contains the JSON string.
allow_snake_case (
bool) – IfTrue, interpretssnake_casekeys as equivalent tocamelCasekeys. Defaults toTrue.
- Returns:
A Python objcet representation of
as_json.- Return type:
HighchartsMeta
- to_dict() dict
Generate a
dictrepresentation of the object compatible with the Highcharts JavaScript library.Note
The
dictrepresentation has a property structure and naming convention that is intentionally consistent with the Highcharts JavaScript library. This is not Pythonic, but it makes managing the interplay between the two languages much, much simpler.
- to_js_literal(filename=None, encoding='utf-8') str | None
Return the object represented as a
strcontaining the JavaScript object literal.
- to_json(filename=None, encoding='utf-8')
Generate a JSON string/byte string representation of the object compatible with the Highcharts JavaScript library.
Note
This method will either return a standard
stror abytesobject depending on the JSON serialization library you are using. For example, if your environment has orjson, the result will be abytesrepresentation of the string.- Parameters:
- Returns:
A JSON representation of the object compatible with the Highcharts library.
- Return type:
- static trim_dict(untrimmed: dict, to_json: bool = False) dict
Remove keys from
untrimmedwhose values areNoneand convert values that have.to_dict()methods.
- static trim_iterable(untrimmed, to_json=False)
Convert any
EnforcedNullTypevalues inuntrimmedto'null'.
- property accessibility: DataPointAccessibility | None
Accessibility options for a data point.
- Return type:
DataPointAccessibilityorNone
- property class_name: str | None
The additional CSS class name to apply to the data point’s graphical elements.
- property color: str | Gradient | Pattern | None
The color of the individual data point. Defaults to
None.
- property color_index: int | None
When operating in styled mode, a specific color index to use for the point, so its graphic representations are given the class name
highcharts-color-{n}. Defaults toNone.
- property custom: JavaScriptDict | None
A reserved subspace to store options and values for customized functionality.
Here you can add additional data for your own event callbacks and formatter callbacks.
- property data_labels: DataLabel | None
Individual data label for the data point.
- Return type:
DataLabelorNone
- property description: str | None
A description of the data point to add to the screen reader information about the data point.
- Return type:
- property direction: int | float | Decimal | None
The windirection in degrees, where 0 is north (pointing towards south). Defaults to
None.- Return type:
numeric or
None
- property drag_drop: DragDropOptions | None
The draggable-points module allows points to be moved around or modified in the chart.
In addition to the options mentioned under the dragDrop API structure, the module fires three (JavaScript) events:
point.dragStartpoint.dragpoint.drop
- Return type:
DragDropOptionsorNone
- property drilldown: str | None
The
idof a series in thedrilldown.seriesarray to use as a drilldown destination for this point. Defaults toNone.
- property events: PointEvents | None
Event handlers for individual data points.
- Return type:
PointEventsorNone
- property id: str | None
The id of the data point. Defaults to
None.Note
This can be used (in JavaScript) after render time to get a pointer to the point object through
chart.get().
- property label_rank: int | float | Decimal | None
The rank for this point’s data label in the case of collision. Defaults to
None.Note
If two data labels are about to overlap, the data label for the point with the highest
label_rankwill be shown.- Return type:
numeric or
None
- property marker: Marker | None
Options for the point markers of line-like series.
- Return type:
MarkerorNone
- property name: str | None
The name to display for the point in data labels, tooltips, in legends, etc. Defaults to
None.
- property selected: bool | None
If
True, indicates that the data point is initially selected. Defaults toNone, which behaves asFalse.
- property value: int | float | Decimal | None
The wind speed in meters per second. Defaults to
None.- Return type:
numeric or
None
- property x: str | date | datetime | int | float | Decimal | None
The point’s location on the x-axis. Defaults to
None.If
None, the point’s position on the x-axis will be automatically determined based on its position in the series’dataarray. The first point will be given anxvalue of0, or the series’point_startvalue. Each subsequent point will be incremented either by1or the value ofpoint_interval.
class: XRangeData
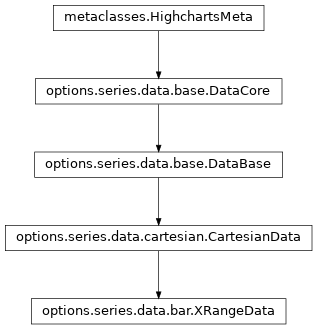
- class XRangeData(**kwargs)[source]
Variant of
CartesianDatawhich is used for data points in an X-Range series.Class Inheritance
- copy(other=None, overwrite=True, **kwargs)
Copy the configuration settings from this instance to the
otherinstance.- Parameters:
other (
HighchartsMeta) – The target instance to which the properties of this instance should be copied. IfNone, will create a new instance and populate it with properties copied fromself. Defaults toNone.overwrite (
bool) – ifTrue, properties inotherthat are already set will be overwritten by their counterparts inself. Defaults toTrue.kwargs – Additional keyword arguments. Some special descendents of
HighchartsMetamay have special implementations of this method which rely on additional keyword arguments.
- Returns:
A mutated version of
otherwith new property values
- classmethod from_array(value)[source]
Creates a collection of data point instances, parsing the contents of
valueas an array (iterable). This method is specifically used to parse data that is input to Highcharts for Python without property names, in an array-organized structure as described in the Highcharts JS documentation.See also
The specific structure of the expected array is highly dependent on the type of data point that the series needs, which itself is dependent on the series type itself.
Please review the detailed series documentation for series type-specific details of relevant array structures.
Note
An example of how this works for a simple
LineSeries(which usesCartesianDatadata points) would be:my_series = LineSeries() # A simple array of numerical values which correspond to the Y value of the # data point my_series.data = [0, 5, 3, 5] # An array containing 2-member arrays (corresponding to the X and Y values # of the data point) my_series.data = [ [0, 0], [1, 5], [2, 3], [3, 5] ] # An array of dict with named values my_series.data = [ { 'x': 0, 'y': 0, 'name': 'Point1', 'color': '#00FF00' }, { 'x': 1, 'y': 5, 'name': 'Point2', 'color': '#CCC' }, { 'x': 2, 'y': 3, 'name': 'Point3', 'color': '#999' }, { 'x': 3, 'y': 5, 'name': 'Point4', 'color': '#000' } ]
- Parameters:
value (iterable) –
The value that should contain the data which will be converted into data point instances.
Note
If
valueis not an iterable, it will be converted into an iterable to be further de-serialized correctly.- Returns:
Collection of data point instances (descended from
DataBase)- Return type:
- classmethod from_dict(as_dict: dict, allow_snake_case: bool = True)
Construct an instance of the class from a
dictobject.
- classmethod from_js_literal(as_str_or_file, allow_snake_case: bool = True, _break_loop_on_failure: bool = False)
Return a Python object representation of a Highcharts JavaScript object literal.
- Parameters:
as_str_or_file (
str) – The JavaScript object literal, represented either as astror as a filename which contains the JS object literal.allow_snake_case (
bool) – IfTrue, interpretssnake_casekeys as equivalent tocamelCasekeys. Defaults toTrue._break_loop_on_failure (
bool) – IfTrue, will break any looping operations in the event of a failure. Otherwise, will attempt to repair the failure. Defaults toFalse.
- Returns:
A Python object representation of the Highcharts JavaScript object literal.
- Return type:
HighchartsMeta
- classmethod from_json(as_json_or_file, allow_snake_case: bool = True)
Construct an instance of the class from a JSON string.
- Parameters:
as_json_or_file – The JSON string for the object or the filename of a file that contains the JSON string.
allow_snake_case (
bool) – IfTrue, interpretssnake_casekeys as equivalent tocamelCasekeys. Defaults toTrue.
- Returns:
A Python objcet representation of
as_json.- Return type:
HighchartsMeta
- to_dict() dict
Generate a
dictrepresentation of the object compatible with the Highcharts JavaScript library.Note
The
dictrepresentation has a property structure and naming convention that is intentionally consistent with the Highcharts JavaScript library. This is not Pythonic, but it makes managing the interplay between the two languages much, much simpler.
- to_js_literal(filename=None, encoding='utf-8') str | None
Return the object represented as a
strcontaining the JavaScript object literal.
- to_json(filename=None, encoding='utf-8')
Generate a JSON string/byte string representation of the object compatible with the Highcharts JavaScript library.
Note
This method will either return a standard
stror abytesobject depending on the JSON serialization library you are using. For example, if your environment has orjson, the result will be abytesrepresentation of the string.- Parameters:
- Returns:
A JSON representation of the object compatible with the Highcharts library.
- Return type:
- static trim_dict(untrimmed: dict, to_json: bool = False) dict
Remove keys from
untrimmedwhose values areNoneand convert values that have.to_dict()methods.
- static trim_iterable(untrimmed, to_json=False)
Convert any
EnforcedNullTypevalues inuntrimmedto'null'.
- property accessibility: DataPointAccessibility | None
Accessibility options for a data point.
- Return type:
DataPointAccessibilityorNone
- property class_name: str | None
The additional CSS class name to apply to the data point’s graphical elements.
- property color: str | Gradient | Pattern | None
The color of the individual data point. Defaults to
None.
- property color_index: int | None
When operating in styled mode, a specific color index to use for the point, so its graphic representations are given the class name
highcharts-color-{n}. Defaults toNone.
- property custom: JavaScriptDict | None
A reserved subspace to store options and values for customized functionality.
Here you can add additional data for your own event callbacks and formatter callbacks.
- property data_labels: DataLabel | None
Individual data label for the data point.
- Return type:
DataLabelorNone
- property description: str | None
A description of the data point to add to the screen reader information about the data point.
- Return type:
- property drag_drop: DragDropOptions | None
The draggable-points module allows points to be moved around or modified in the chart.
In addition to the options mentioned under the dragDrop API structure, the module fires three (JavaScript) events:
point.dragStartpoint.dragpoint.drop
- Return type:
DragDropOptionsorNone
- property drilldown: str | None
The
idof a series in thedrilldown.seriesarray to use as a drilldown destination for this point. Defaults toNone.
- property events: PointEvents | None
Event handlers for individual data points.
- Return type:
PointEventsorNone
- property id: str | None
The id of the data point. Defaults to
None.Note
This can be used (in JavaScript) after render time to get a pointer to the point object through
chart.get().
- property label_rank: int | float | Decimal | None
The rank for this point’s data label in the case of collision. Defaults to
None.Note
If two data labels are about to overlap, the data label for the point with the highest
label_rankwill be shown.- Return type:
numeric or
None
- property marker: Marker | None
Options for the point markers of line-like series.
- Return type:
MarkerorNone
- property name: str | None
The name to display for the point in data labels, tooltips, in legends, etc. Defaults to
None.
- property partial_fill: PartialFillOptions | None
A partial fill for the data point, typically used to visualize how much of a task is performed. Defaults to
None.- Return type:
PartialFillOptionsorNone
- property selected: bool | None
If
True, indicates that the data point is initially selected. Defaults toNone, which behaves asFalse.
- property x: str | date | datetime | int | float | Decimal | None
The starting X-value of the range point. Defaults to
None.If
None, the point’s position on the x-axis will be automatically determined based on its position in the series’dataarray. The first point will be given anxvalue of0, or the series’point_startvalue. Each subsequent point will be incremented either by1or the value ofpoint_interval.
- property x2: str | date | datetime | int | float | Decimal | None
The ending X-value of the range point. Defaults to
None.If
None, the point’s position on the x-axis will be automatically determined based on its position in the series’dataarray. The first point will be given anx2value of0, or the series’point_startvalue. Each subsequent point will be incremented either by1or the value ofpoint_interval.