.geometric
class: GeometricData
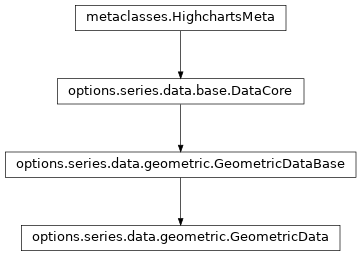
- class GeometricData(**kwargs)[source]
Data point that can be represented on a map visualization.
Class Inheritance
- copy(other=None, overwrite=True, **kwargs)
Copy the configuration settings from this instance to the
otherinstance.- Parameters:
other (
HighchartsMeta) – The target instance to which the properties of this instance should be copied. IfNone, will create a new instance and populate it with properties copied fromself. Defaults toNone.overwrite (
bool) – ifTrue, properties inotherthat are already set will be overwritten by their counterparts inself. Defaults toTrue.kwargs – Additional keyword arguments. Some special descendents of
HighchartsMetamay have special implementations of this method which rely on additional keyword arguments.
- Returns:
A mutated version of
otherwith new property values
- classmethod from_dict(as_dict: dict, allow_snake_case: bool = True)
Construct an instance of the class from a
dictobject.
- classmethod from_js_literal(as_str_or_file, allow_snake_case: bool = True, _break_loop_on_failure: bool = False)
Return a Python object representation of a Highcharts JavaScript object literal.
- Parameters:
as_str_or_file (
str) – The JavaScript object literal, represented either as astror as a filename which contains the JS object literal.allow_snake_case (
bool) – IfTrue, interpretssnake_casekeys as equivalent tocamelCasekeys. Defaults toTrue._break_loop_on_failure (
bool) – IfTrue, will break any looping operations in the event of a failure. Otherwise, will attempt to repair the failure. Defaults toFalse.
- Returns:
A Python object representation of the Highcharts JavaScript object literal.
- Return type:
HighchartsMeta
- classmethod from_json(as_json_or_file, allow_snake_case: bool = True)
Construct an instance of the class from a JSON string.
- Parameters:
as_json_or_file – The JSON string for the object or the filename of a file that contains the JSON string.
allow_snake_case (
bool) – IfTrue, interpretssnake_casekeys as equivalent tocamelCasekeys. Defaults toTrue.
- Returns:
A Python objcet representation of
as_json.- Return type:
HighchartsMeta
- to_dict() dict
Generate a
dictrepresentation of the object compatible with the Highcharts JavaScript library.Note
The
dictrepresentation has a property structure and naming convention that is intentionally consistent with the Highcharts JavaScript library. This is not Pythonic, but it makes managing the interplay between the two languages much, much simpler.
- to_js_literal(filename=None, encoding='utf-8') str | None
Return the object represented as a
strcontaining the JavaScript object literal.
- to_json(filename=None, encoding='utf-8')
Generate a JSON string/byte string representation of the object compatible with the Highcharts JavaScript library.
Note
This method will either return a standard
stror abytesobject depending on the JSON serialization library you are using. For example, if your environment has orjson, the result will be abytesrepresentation of the string.- Parameters:
- Returns:
A JSON representation of the object compatible with the Highcharts library.
- Return type:
- static trim_dict(untrimmed: dict, to_json: bool = False) dict
Remove keys from
untrimmedwhose values areNoneand convert values that have.to_dict()methods.
- static trim_iterable(untrimmed, to_json=False)
Convert any
EnforcedNullTypevalues inuntrimmedto'null'.
- property color: str | Gradient | Pattern | None
The color of the individual data point. Defaults to
None.
- property data_labels: DataLabel | List[DataLabel] | None
Individual data label for the data point.
Note
To have multiple data labels per data point, you can also supply a collection of
DataLabelconfiguration settings.
- property drilldown: str | None
The
idof a series in thedrilldown.seriesarray to use as a drilldown destination for this point. Defaults toNone.
- property events: PointEvents | None
Event handlers for individual data points.
- Return type:
PointEventsorNone
- property geometry: Feature | None
The geometry associated with a data point, expressed as a GeoJSON
Feature. Defaults toNone.Tip
Best practice!
To make your code easier to maintain through better separation between your visualization’s structure (e.g. the rendered map) and the data visualized within that structure, it is recommended to leave
.geometryempty and to use the series’.map_dataproperty to define the map’s geometry.- Return type:
- property id: str | None
The id of the data point. Defaults to
None.Note
This can be used (in JavaScript) after render time to get a pointer to the point object through
chart.get().
- property label_rank: int | float | Decimal | None
The rank for this point’s data label in the case of collision. Defaults to
None.Note
If two data labels are about to overlap, the data label for the point with the highest
label_rankwill be shown.- Return type:
numeric or
None
- property middle_x: int | float | Decimal | None
The horizontal mid-point of the map area corresponding to the data point (used to place the data label), expressed as a numerical value between
0and1. Defaults to0.5.- Return type:
numeric or
None
- property middle_y: int | float | Decimal | None
The vertical mid-point of the map area corresponding to the data point (used to place the data label), expressed as a numerical value between
0and1. Defaults to0.5.- Return type:
numeric or
None
- property name: str | None
The name to display for the point in data labels, tooltips, in legends, etc. Defaults to
None.
- property path: str | None
The SVG path of the shape associated with the data point. Defaults to
None.Tip
Best practice!
To make your code easier to maintain through better separation between your visualization’s structure (e.g. the rendered map) and the data visualized within that structure, it is recommended to leave
.geometryempty and to use the series’.map_dataproperty to define the map’s geometry.Caution
For compatibily with old IE, not all SVG path definitions are supported, but M, L, and C operators are supported.
class: GeometricZData
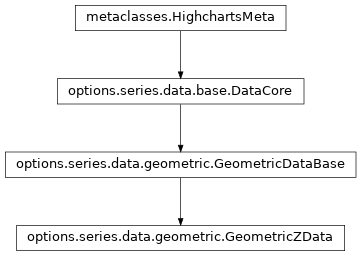
- class GeometricZData(**kwargs)[source]
Data point that can be represented on a
MapBubbleSeriesfeaturing azvalue.Class Inheritance
- copy(other=None, overwrite=True, **kwargs)
Copy the configuration settings from this instance to the
otherinstance.- Parameters:
other (
HighchartsMeta) – The target instance to which the properties of this instance should be copied. IfNone, will create a new instance and populate it with properties copied fromself. Defaults toNone.overwrite (
bool) – ifTrue, properties inotherthat are already set will be overwritten by their counterparts inself. Defaults toTrue.kwargs – Additional keyword arguments. Some special descendents of
HighchartsMetamay have special implementations of this method which rely on additional keyword arguments.
- Returns:
A mutated version of
otherwith new property values
- classmethod from_dict(as_dict: dict, allow_snake_case: bool = True)
Construct an instance of the class from a
dictobject.
- classmethod from_js_literal(as_str_or_file, allow_snake_case: bool = True, _break_loop_on_failure: bool = False)
Return a Python object representation of a Highcharts JavaScript object literal.
- Parameters:
as_str_or_file (
str) – The JavaScript object literal, represented either as astror as a filename which contains the JS object literal.allow_snake_case (
bool) – IfTrue, interpretssnake_casekeys as equivalent tocamelCasekeys. Defaults toTrue._break_loop_on_failure (
bool) – IfTrue, will break any looping operations in the event of a failure. Otherwise, will attempt to repair the failure. Defaults toFalse.
- Returns:
A Python object representation of the Highcharts JavaScript object literal.
- Return type:
HighchartsMeta
- classmethod from_json(as_json_or_file, allow_snake_case: bool = True)
Construct an instance of the class from a JSON string.
- Parameters:
as_json_or_file – The JSON string for the object or the filename of a file that contains the JSON string.
allow_snake_case (
bool) – IfTrue, interpretssnake_casekeys as equivalent tocamelCasekeys. Defaults toTrue.
- Returns:
A Python objcet representation of
as_json.- Return type:
HighchartsMeta
- to_dict() dict
Generate a
dictrepresentation of the object compatible with the Highcharts JavaScript library.Note
The
dictrepresentation has a property structure and naming convention that is intentionally consistent with the Highcharts JavaScript library. This is not Pythonic, but it makes managing the interplay between the two languages much, much simpler.
- to_js_literal(filename=None, encoding='utf-8') str | None
Return the object represented as a
strcontaining the JavaScript object literal.
- to_json(filename=None, encoding='utf-8')
Generate a JSON string/byte string representation of the object compatible with the Highcharts JavaScript library.
Note
This method will either return a standard
stror abytesobject depending on the JSON serialization library you are using. For example, if your environment has orjson, the result will be abytesrepresentation of the string.- Parameters:
- Returns:
A JSON representation of the object compatible with the Highcharts library.
- Return type:
- static trim_dict(untrimmed: dict, to_json: bool = False) dict
Remove keys from
untrimmedwhose values areNoneand convert values that have.to_dict()methods.
- static trim_iterable(untrimmed, to_json=False)
Convert any
EnforcedNullTypevalues inuntrimmedto'null'.
- property color: str | Gradient | Pattern | None
The color of the individual data point. Defaults to
None.
- property data_labels: DataLabel | List[DataLabel] | None
Individual data label for the data point.
Note
To have multiple data labels per data point, you can also supply a collection of
DataLabelconfiguration settings.
- property drilldown: str | None
The
idof a series in thedrilldown.seriesarray to use as a drilldown destination for this point. Defaults toNone.
- property events: PointEvents | None
Event handlers for individual data points.
- Return type:
PointEventsorNone
- property geometry: Feature | None
The geometry associated with a data point, expressed as a GeoJSON
Feature. Defaults toNone.Tip
Best practice!
To make your code easier to maintain through better separation between your visualization’s structure (e.g. the rendered map) and the data visualized within that structure, it is recommended to leave
.geometryempty and to use the series’.map_dataproperty to define the map’s geometry.- Return type:
- property id: str | None
The id of the data point. Defaults to
None.Note
This can be used (in JavaScript) after render time to get a pointer to the point object through
chart.get().
- property label_rank: int | float | Decimal | None
The rank for this point’s data label in the case of collision. Defaults to
None.Note
If two data labels are about to overlap, the data label for the point with the highest
label_rankwill be shown.- Return type:
numeric or
None
- property name: str | None
The name to display for the point in data labels, tooltips, in legends, etc. Defaults to
None.
class: GeometricLatLonData
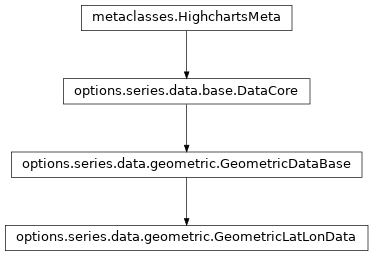
- class GeometricLatLonData(**kwargs)[source]
Data point that can be represented on a
MapPointSeriesfeaturing latitude/longitude coordinates, an x-value, and a y-value.Class Inheritance
- copy(other=None, overwrite=True, **kwargs)
Copy the configuration settings from this instance to the
otherinstance.- Parameters:
other (
HighchartsMeta) – The target instance to which the properties of this instance should be copied. IfNone, will create a new instance and populate it with properties copied fromself. Defaults toNone.overwrite (
bool) – ifTrue, properties inotherthat are already set will be overwritten by their counterparts inself. Defaults toTrue.kwargs – Additional keyword arguments. Some special descendents of
HighchartsMetamay have special implementations of this method which rely on additional keyword arguments.
- Returns:
A mutated version of
otherwith new property values
- classmethod from_dict(as_dict: dict, allow_snake_case: bool = True)
Construct an instance of the class from a
dictobject.
- classmethod from_js_literal(as_str_or_file, allow_snake_case: bool = True, _break_loop_on_failure: bool = False)
Return a Python object representation of a Highcharts JavaScript object literal.
- Parameters:
as_str_or_file (
str) – The JavaScript object literal, represented either as astror as a filename which contains the JS object literal.allow_snake_case (
bool) – IfTrue, interpretssnake_casekeys as equivalent tocamelCasekeys. Defaults toTrue._break_loop_on_failure (
bool) – IfTrue, will break any looping operations in the event of a failure. Otherwise, will attempt to repair the failure. Defaults toFalse.
- Returns:
A Python object representation of the Highcharts JavaScript object literal.
- Return type:
HighchartsMeta
- classmethod from_json(as_json_or_file, allow_snake_case: bool = True)
Construct an instance of the class from a JSON string.
- Parameters:
as_json_or_file – The JSON string for the object or the filename of a file that contains the JSON string.
allow_snake_case (
bool) – IfTrue, interpretssnake_casekeys as equivalent tocamelCasekeys. Defaults toTrue.
- Returns:
A Python objcet representation of
as_json.- Return type:
HighchartsMeta
- to_dict() dict
Generate a
dictrepresentation of the object compatible with the Highcharts JavaScript library.Note
The
dictrepresentation has a property structure and naming convention that is intentionally consistent with the Highcharts JavaScript library. This is not Pythonic, but it makes managing the interplay between the two languages much, much simpler.
- to_js_literal(filename=None, encoding='utf-8') str | None
Return the object represented as a
strcontaining the JavaScript object literal.
- to_json(filename=None, encoding='utf-8')
Generate a JSON string/byte string representation of the object compatible with the Highcharts JavaScript library.
Note
This method will either return a standard
stror abytesobject depending on the JSON serialization library you are using. For example, if your environment has orjson, the result will be abytesrepresentation of the string.- Parameters:
- Returns:
A JSON representation of the object compatible with the Highcharts library.
- Return type:
- static trim_dict(untrimmed: dict, to_json: bool = False) dict
Remove keys from
untrimmedwhose values areNoneand convert values that have.to_dict()methods.
- static trim_iterable(untrimmed, to_json=False)
Convert any
EnforcedNullTypevalues inuntrimmedto'null'.
- property color: str | Gradient | Pattern | None
The color of the individual data point. Defaults to
None.
- property data_labels: DataLabel | List[DataLabel] | None
Individual data label for the data point.
Note
To have multiple data labels per data point, you can also supply a collection of
DataLabelconfiguration settings.
- property drilldown: str | None
The
idof a series in thedrilldown.seriesarray to use as a drilldown destination for this point. Defaults toNone.
- property events: PointEvents | None
Event handlers for individual data points.
- Return type:
PointEventsorNone
- property geometry: Feature | None
The geometry associated with a data point, expressed as a GeoJSON
Feature. Defaults toNone.Tip
Best practice!
To make your code easier to maintain through better separation between your visualization’s structure (e.g. the rendered map) and the data visualized within that structure, it is recommended to leave
.geometryempty and to use the series’.map_dataproperty to define the map’s geometry.- Return type:
- property id: str | None
The id of the data point. Defaults to
None.Note
This can be used (in JavaScript) after render time to get a pointer to the point object through
chart.get().
- property label_rank: int | float | Decimal | None
The rank for this point’s data label in the case of collision. Defaults to
None.Note
If two data labels are about to overlap, the data label for the point with the highest
label_rankwill be shown.- Return type:
numeric or
None
- property lat: int | float | Decimal | None
The latitude of the data point. Defaults to
None.Warning
Must be combined with the
.lonto work as expected...warning:
Overrides the
:meth:`.x <highcharts_maps.options.series.data.geometric.GeometricLatLonData.x>`
value if set.
- Return type:
numeric or
None
- property lon: int | float | Decimal | None
The longitude of the data point. Defaults to
None.Warning
Must be combined with the
.latto work as expected.Warning
Overrides the
.yvalue if set.- Return type:
numeric or
None
- property name: str | None
The name to display for the point in data labels, tooltips, in legends, etc. Defaults to
None.
- property properties: dict | None
Collection of properties associated with the geometric data point.
class: GeometricDataBase
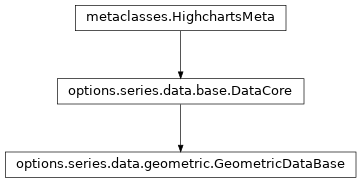
- class GeometricDataBase(**kwargs)[source]
Base class for representing geometric data on map charts.
Class Inheritance
- copy(other=None, overwrite=True, **kwargs)
Copy the configuration settings from this instance to the
otherinstance.- Parameters:
other (
HighchartsMeta) – The target instance to which the properties of this instance should be copied. IfNone, will create a new instance and populate it with properties copied fromself. Defaults toNone.overwrite (
bool) – ifTrue, properties inotherthat are already set will be overwritten by their counterparts inself. Defaults toTrue.kwargs – Additional keyword arguments. Some special descendents of
HighchartsMetamay have special implementations of this method which rely on additional keyword arguments.
- Returns:
A mutated version of
otherwith new property values
- classmethod from_dict(as_dict: dict, allow_snake_case: bool = True)
Construct an instance of the class from a
dictobject.
- classmethod from_js_literal(as_str_or_file, allow_snake_case: bool = True, _break_loop_on_failure: bool = False)
Return a Python object representation of a Highcharts JavaScript object literal.
- Parameters:
as_str_or_file (
str) – The JavaScript object literal, represented either as astror as a filename which contains the JS object literal.allow_snake_case (
bool) – IfTrue, interpretssnake_casekeys as equivalent tocamelCasekeys. Defaults toTrue._break_loop_on_failure (
bool) – IfTrue, will break any looping operations in the event of a failure. Otherwise, will attempt to repair the failure. Defaults toFalse.
- Returns:
A Python object representation of the Highcharts JavaScript object literal.
- Return type:
HighchartsMeta
- classmethod from_json(as_json_or_file, allow_snake_case: bool = True)
Construct an instance of the class from a JSON string.
- Parameters:
as_json_or_file – The JSON string for the object or the filename of a file that contains the JSON string.
allow_snake_case (
bool) – IfTrue, interpretssnake_casekeys as equivalent tocamelCasekeys. Defaults toTrue.
- Returns:
A Python objcet representation of
as_json.- Return type:
HighchartsMeta
- to_dict() dict
Generate a
dictrepresentation of the object compatible with the Highcharts JavaScript library.Note
The
dictrepresentation has a property structure and naming convention that is intentionally consistent with the Highcharts JavaScript library. This is not Pythonic, but it makes managing the interplay between the two languages much, much simpler.
- to_js_literal(filename=None, encoding='utf-8') str | None
Return the object represented as a
strcontaining the JavaScript object literal.
- to_json(filename=None, encoding='utf-8')
Generate a JSON string/byte string representation of the object compatible with the Highcharts JavaScript library.
Note
This method will either return a standard
stror abytesobject depending on the JSON serialization library you are using. For example, if your environment has orjson, the result will be abytesrepresentation of the string.- Parameters:
- Returns:
A JSON representation of the object compatible with the Highcharts library.
- Return type:
- static trim_dict(untrimmed: dict, to_json: bool = False) dict
Remove keys from
untrimmedwhose values areNoneand convert values that have.to_dict()methods.
- static trim_iterable(untrimmed, to_json=False)
Convert any
EnforcedNullTypevalues inuntrimmedto'null'.
- property color: str | Gradient | Pattern | None
The color of the individual data point. Defaults to
None.
- property data_labels: DataLabel | List[DataLabel] | None
Individual data label for the data point.
Note
To have multiple data labels per data point, you can also supply a collection of
DataLabelconfiguration settings.
- property drilldown: str | None
The
idof a series in thedrilldown.seriesarray to use as a drilldown destination for this point. Defaults toNone.
- property events: PointEvents | None
Event handlers for individual data points.
- Return type:
PointEventsorNone
- property geometry: Feature | None
The geometry associated with a data point, expressed as a GeoJSON
Feature. Defaults toNone.Tip
Best practice!
To make your code easier to maintain through better separation between your visualization’s structure (e.g. the rendered map) and the data visualized within that structure, it is recommended to leave
.geometryempty and to use the series’.map_dataproperty to define the map’s geometry.- Return type:
- property id: str | None
The id of the data point. Defaults to
None.Note
This can be used (in JavaScript) after render time to get a pointer to the point object through
chart.get().
- property label_rank: int | float | Decimal | None
The rank for this point’s data label in the case of collision. Defaults to
None.Note
If two data labels are about to overlap, the data label for the point with the highest
label_rankwill be shown.- Return type:
numeric or
None