.accessibility
class: Accessibility <highcharts_maps.options.accessibility.Accessibility>
- class Accessibility(**kwargs)[source]
Options for configuring accessibility for the chart.
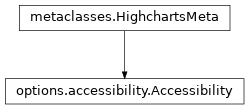
Class Inheritance

- copy(other=None, overwrite=True, **kwargs)
Copy the configuration settings from this instance to the
otherinstance.- Parameters:
other (
HighchartsMeta) – The target instance to which the properties of this instance should be copied. IfNone, will create a new instance and populate it with properties copied fromself. Defaults toNone.overwrite (
bool) – ifTrue, properties inotherthat are already set will be overwritten by their counterparts inself. Defaults toTrue.kwargs – Additional keyword arguments. Some special descendents of
HighchartsMetamay have special implementations of this method which rely on additional keyword arguments.
- Returns:
A mutated version of
otherwith new property values
- classmethod from_dict(as_dict: dict, allow_snake_case: bool = True)
Construct an instance of the class from a
dictobject.
- classmethod from_js_literal(as_str_or_file, allow_snake_case: bool = True, _break_loop_on_failure: bool = False)
Return a Python object representation of a Highcharts JavaScript object literal.
- Parameters:
as_str_or_file (
str) – The JavaScript object literal, represented either as astror as a filename which contains the JS object literal.allow_snake_case (
bool) – IfTrue, interpretssnake_casekeys as equivalent tocamelCasekeys. Defaults toTrue._break_loop_on_failure (
bool) – IfTrue, will break any looping operations in the event of a failure. Otherwise, will attempt to repair the failure. Defaults toFalse.
- Returns:
A Python object representation of the Highcharts JavaScript object literal.
- Return type:
HighchartsMeta
- classmethod from_json(as_json_or_file, allow_snake_case: bool = True)
Construct an instance of the class from a JSON string.
- Parameters:
as_json_or_file – The JSON string for the object or the filename of a file that contains the JSON string.
allow_snake_case (
bool) – IfTrue, interpretssnake_casekeys as equivalent tocamelCasekeys. Defaults toTrue.
- Returns:
A Python objcet representation of
as_json.- Return type:
HighchartsMeta
- to_dict() dict
Generate a
dictrepresentation of the object compatible with the Highcharts JavaScript library.Note
The
dictrepresentation has a property structure and naming convention that is intentionally consistent with the Highcharts JavaScript library. This is not Pythonic, but it makes managing the interplay between the two languages much, much simpler.
- to_js_literal(filename=None, encoding='utf-8') str | None
Return the object represented as a
strcontaining the JavaScript object literal.
- to_json(filename=None, encoding='utf-8')
Generate a JSON string/byte string representation of the object compatible with the Highcharts JavaScript library.
Note
This method will either return a standard
stror abytesobject depending on the JSON serialization library you are using. For example, if your environment has orjson, the result will be abytesrepresentation of the string.- Parameters:
- Returns:
A JSON representation of the object compatible with the Highcharts library.
- Return type:
- static trim_dict(untrimmed: dict, to_json: bool = False) dict
Remove keys from
untrimmedwhose values areNoneand convert values that have.to_dict()methods.
- static trim_iterable(untrimmed, to_json=False)
Convert any
EnforcedNullTypevalues inuntrimmedto'null'.
- property announce_new_data: AnnounceNewData | None
Options for announcing new data to screen reader users.
Tip
Useful for dynamic data applications and drilldown.
Keep in mind that frequent announcements will not be useful to users, as they won’t have time to explore the new data. For these applications, consider making snapshots of the data accessible, and do the announcements in batches.
- Returns:
Configuration for the announcement of new data to screen reader users.
- Return type:
AnnounceNewDataorNone
- property custom_components: CustomAccessibilityComponents | None
Property which supports the definition of custom components added to the accessibility module. Defaults to
None.Tip
Remember to add the component to the
keyboard_navigation.order()for the keyboard navigation to be usable.- Returns:
Custom components that have been added to the accessibility module.
- Return type:
- property description: str | None
A text description of the chart.
If the Accessibility module is loaded, this option is included by default as a long description of the chart in the hidden screen reader information region.
Warning
Prefer using
Accessibility.linked_description()andOptions.caption()instead.Since Highcharts now supports captions and linked descriptions, it is preferred to define the description using those methods, as a visible caption/description benefits all users. If the
accessibility.descriptionoption is defined, the linked description is ignored, and the caption is hidden from screen reader users.
- property enabled: bool | None
If
True, enables accessibility functionality for the chart. Defaults toTrue.See also
For more information on how to include these features, and why this is recommended, see Highcharts Accessibility
Note
Highcharts will by default emit a warning to the console if the accessibility module is not loaded. Setting this option to false will override and silence the warning.
Once the module is loaded, setting this option to false will disable the module for this chart.
- Returns:
Flag indicating whether the
Accessibilitymodule is enabled for the chart.- Return type:
- property high_contrast_theme: Any
Theme to apply to the chart when Windows High Contrast Mode is detected.
By default, a high contrast theme matching the high contrast system system colors is used.
- Returns:
Theme to apply to the chart when high contrast mode is detected.
- Return type:
HighContrastThemeorNone
Options for keyboard navigation.
- Returns:
Configuration for keyboard navigation.
- Return type:
KeyboardNavigationorNone
- property landmark_verbosity: str | None
Amount of landmarks/regions to create for screen reader users.
More landmarks can make navigation with screen readers easier, but can be distracting if there are lots of charts on the page.
Three modes are available:
'all': Adds regions for all series, legend, information region.'one': Adds a single landmark per chart.'disabled': No landmarks are added.
Defaults to
'all'.
- property linked_description: str | None
Link the chart to an HTML element describing the contents of the chart.
Hint
It is always recommended to describe charts using visible text, to improve SEO as well as accessibility for users with disabilities.
This option lets an HTML element with a description be linked to the chart, so that screen reader users can connect the two.
By setting this option to a string, Highcharts runs the string as an HTML selector query on the entire document. If there is only a single match, this element is linked to the chart. The content of the linked element will be included in the chart description for screen reader users.
By default, the chart looks for an adjacent sibling element with the
highcharts-description(CSS) class.The feature can be disabled by setting the option to an empty string, or overridden by providing the :meth`Accessibility.description` option. Alternatively, the HTML element to link can be passed in directly as an HTML node.
Hint
If you need the description to be part of the exported image, consider using the caption feature.
If you need the description to be hidden visually, use the
Accessibility.description()option.Defaults to
'*[data-highcharts-chart="{index}"] + .highcharts-description'.
- property point: AccessibilityPoint | None
Options for describing individual points.
- Returns:
Configuration for how to describe individual points on the chart.
- Return type:
AccessibilityPointorNone
- property screen_reader_section: ScreenReaderSection | None
Accessibility options for the screen reader information sections added before and after the chart.
- Returns:
Configuration for the screen reader sections before and after the chart.
- Return type:
ScreenReaderSectionorNone
- property series: SeriesAccessibility | None
Accessibility options global to all data series.
Hint
Individual series can also have specific accessibility options set.
- Returns:
Global accessibility options applied to all data series.
- Return type:
SeriesAccessibilityorNone
- property type_description: str | None
A text description of the chart type.
If the Accessibility module is loaded, this will be included in the description of the chart in the screen reader information region.
Note
Highcharts will by default attempt to guess the chart type, but for more complex charts it is recommended to specify this property for clarity.
class: CustomAccessibilityComponents <highcharts_maps.options.accessibility.CustomAccessibilityComponents>
- class CustomAccessibilityComponents(dict=None, /, **kwargs)[source]
JavaScript object which contains a map of component names to instances of classes inheriting from the (JavaScript) Highcharts.AccessibilityComponent base class.
Tip
Remember to add the component to the
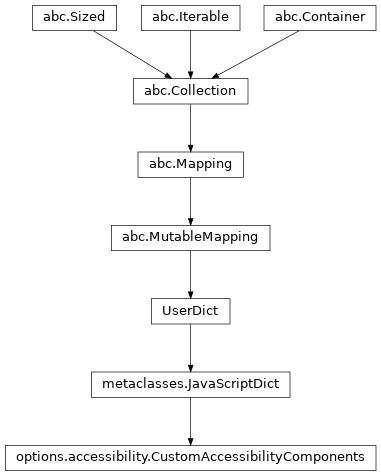
keyboard_navigation.order()for the keyboard navigation to be usable.Class Inheritance

- clear() None. Remove all items from D.
- classmethod from_json(as_json)
Construct an instance of the class from a JSON string.
- get(k[, d]) D[k] if k in D, else d. d defaults to None.
- items() a set-like object providing a view on D's items
- keys() a set-like object providing a view on D's keys
- pop(k[, d]) v, remove specified key and return the corresponding value.
If key is not found, d is returned if given, otherwise KeyError is raised.
- popitem() (k, v), remove and return some (key, value) pair
as a 2-tuple; but raise KeyError if D is empty.
- setdefault(k[, d]) D.get(k,d), also set D[k]=d if k not in D
- to_dict()
Generate a
dictrepresentation of the object compatible with the Highcharts JavaScript library.Note
The
dictrepresentation has a property structure and naming convention that is intentionally consistent with the Highcharts JavaScript library. This is not Pythonic, but it makes managing the interplay between the two languages much, much simpler.
- to_js_literal(filename=None, encoding='utf-8') str | None
Return the object represented as a
strcontaining the JavaScript object literal.
- to_json(filename=None, encoding='utf-8')
Generate a JSON string/byte string representation of the object compatible with the Highcharts JavaScript library.
Note
This method will either return a standard
stror abytesobject depending on the JSON serialization library you are using. For example, if your environment has orjson, the result will be abytesrepresentation of the string.- Parameters:
- Returns:
A JSON representation of the object compatible with the Highcharts library.
- Return type:
- update([E, ]**F) None. Update D from mapping/iterable E and F.
If E present and has a .keys() method, does: for k in E: D[k] = E[k] If E present and lacks .keys() method, does: for (k, v) in E: D[k] = v In either case, this is followed by: for k, v in F.items(): D[k] = v
- values() an object providing a view on D's values
Sub-components
Module |
Classes / Functions |
|---|---|
|
|