.flowmap
class: FlowmapOptions
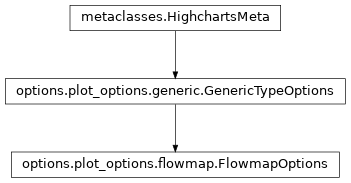
- class FlowmapOptions(**kwargs)[source]
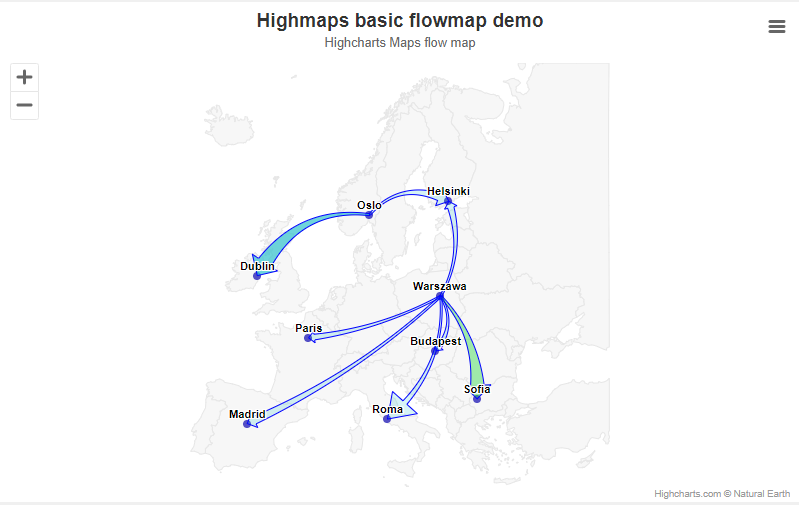
A flowmap series is a series laid out on top of a map series that displays route paths (e.g. flight or naval routes), or directional flows on a map. It creates a link between two points on a map chart.
Class Inheritance
- copy(other=None, overwrite=True, **kwargs)
Copy the configuration settings from this instance to the
otherinstance.- Parameters:
other (
HighchartsMeta) – The target instance to which the properties of this instance should be copied. IfNone, will create a new instance and populate it with properties copied fromself. Defaults toNone.overwrite (
bool) – ifTrue, properties inotherthat are already set will be overwritten by their counterparts inself. Defaults toTrue.kwargs – Additional keyword arguments. Some special descendents of
HighchartsMetamay have special implementations of this method which rely on additional keyword arguments.
- Returns:
A mutated version of
otherwith new property values
- classmethod from_dict(as_dict: dict, allow_snake_case: bool = True)
Construct an instance of the class from a
dictobject.
- classmethod from_js_literal(as_str_or_file, allow_snake_case: bool = True, _break_loop_on_failure: bool = False)
Return a Python object representation of a Highcharts JavaScript object literal.
- Parameters:
as_str_or_file (
str) – The JavaScript object literal, represented either as astror as a filename which contains the JS object literal.allow_snake_case (
bool) – IfTrue, interpretssnake_casekeys as equivalent tocamelCasekeys. Defaults toTrue._break_loop_on_failure (
bool) – IfTrue, will break any looping operations in the event of a failure. Otherwise, will attempt to repair the failure. Defaults toFalse.
- Returns:
A Python object representation of the Highcharts JavaScript object literal.
- Return type:
HighchartsMeta
- classmethod from_json(as_json_or_file, allow_snake_case: bool = True)
Construct an instance of the class from a JSON string.
- Parameters:
as_json_or_file – The JSON string for the object or the filename of a file that contains the JSON string.
allow_snake_case (
bool) – IfTrue, interpretssnake_casekeys as equivalent tocamelCasekeys. Defaults toTrue.
- Returns:
A Python objcet representation of
as_json.- Return type:
HighchartsMeta
- get_required_modules(include_extension=False) List[str]
Return the list of URLs from which the Highcharts JavaScript modules needed to render the chart can be retrieved.
- to_dict() dict
Generate a
dictrepresentation of the object compatible with the Highcharts JavaScript library.Note
The
dictrepresentation has a property structure and naming convention that is intentionally consistent with the Highcharts JavaScript library. This is not Pythonic, but it makes managing the interplay between the two languages much, much simpler.
- to_js_literal(filename=None, encoding='utf-8', careful_validation=False) str | None
Return the object represented as a
strcontaining the JavaScript object literal.- Parameters:
along the way using the esprima-python library. Defaults to
False.Warning
Setting this value to
Truewill significantly degrade serialization performance, though it may prove useful for debugging purposes.
- to_json(filename=None, encoding='utf-8', for_export: bool = False)
Generate a JSON string/byte string representation of the object compatible with the Highcharts JavaScript library.
Note
This method will either return a standard
stror abytesobject depending on the JSON serialization library you are using. For example, if your environment has orjson, the result will be abytesrepresentation of the string.- Parameters:
filename (Path-like) – The name of a file to which the JSON string should be persisted. Defaults to
Noneencoding (
str) – The character encoding to apply to the resulting object. Defaults to'utf-8'.for_export (
bool) – IfTrue, indicates that the method is being run to produce a JSON for consumption by the export server. Defaults toFalse.
- Returns:
A JSON representation of the object compatible with the Highcharts library.
- Return type:
- static trim_dict(untrimmed: dict, to_json: bool = False, context: str = None, for_export: bool = False) dict
Remove keys from
untrimmedwhose values areNoneand convert values that have.to_dict()methods.- Parameters:
untrimmed (
dict) – Thedictwhose values may still beNoneor Python objects.to_json (
bool) – IfTrue, will remove all keys fromuntrimmedthat are not serializable to JSON. Defaults toFalse.context (
strorNone) – If provided, will inform the method of the context in which it is being run which may inform special handling cases (e.g. where empty strings may be important / allowable). Defaults toNone.for_export (
bool) – IfTrue, indicates that the method is being run to produce a JSON for consumption by the export server. Defaults toFalse.
- Returns:
Trimmed
dict- Return type:
- static trim_iterable(untrimmed, to_json=False, context: str = None, for_export: bool = False)
Convert any
EnforcedNullTypevalues inuntrimmedto'null'.- Parameters:
untrimmed (iterable) – The iterable whose members may still be
Noneor Python objects.to_json (
bool) – IfTrue, will remove all members fromuntrimmedthat are not serializable to JSON. Defaults toFalse.context (
strorNone) – If provided, will inform the method of the context in which it is being run which may inform special handling cases (e.g. where empty strings may be important / allowable). Defaults toNone.for_export (
bool) – IfTrue, indicates that the method is being run to produce a JSON for consumption by the export server. Defaults toFalse.
- Return type:
iterable
- property accessibility: TypeOptionsAccessibility | None
Accessibility options for a series.
- Return type:
TypeOptionsAccessibilityorNone
- property allow_point_select: bool | None
Allow this series’ points to be selected by clicking on the graphic (columns, point markers, pie slices, map areas etc).
The selected points can be handled in JavaScript by point select and unselect events, or collectively by the (JavaScript)
getSelectedPoints()function.And alternative way of selecting points is through dragging.
Defaults to
False.
- property animation: bool | AnimationOptions | None
Enable or disable the initial animation when a series is displayed.
The animation can also be set as a configuration object. Please note that this option only applies to the initial animation of the series itself. For other animations, see
Chart.animationand theanimationparameter under the (JavaScript) API methods. The following properties are supported:defer: The animation delay time in milliseconds.duration: The duration of the animation in milliseconds.easing: Can be a string reference to an easing function set on the Math object or a function.
Warning
Due to poor performance, animation is disabled in old IE browsers for several chart types.
- Return type:
AnimationOptionsorNone
- property animation_limit: int | float | Decimal | None
For some series, there is a limit that shuts down initial animation by default when the total number of points in the chart is too high. Defaults to
None.For example, for a column chart and its derivatives, animation does not run if there is more than 250 points totally. To disable this cap, set
animation_limittofloat("inf")(which represents infinity).- Return type:
numeric or
None
- property class_name: str | None
The additional CSS class name to apply to the series’ graphical elements.
Note
This option is additive to the default class names - it does not replace them.
- property clip: bool | None
If
False, allows the series to be rendered in the entire plot area. IfTrue, constrains where the series can be rendered within the plot area. Defaults toTrue.
- property color: str | Gradient | Pattern | None
The main color of the series.
In line type series it applies to the line and the point markers unless otherwise specified. In bar type series it applies to the bars unless a color is specified per point. The default value is pulled from the
Options.colors()array.
- property color_axis: str | int | bool | None
When using dual or multiple color axes, this setting defines which color axis the particular series is connected to. It refers to either the
ColorAxis.id()or the index of the axis in theColorAxisarray, with0being the first. Set this option toFalseto prevent a series from connecting to the default color axis.Defaults to
0.
- property color_by_point: bool | None
When using automatic point colors pulled from the global colors or series-specific collections, this option determines whether the chart should receive one color per series (
False) or one color per point (True).Defaults to
False.
- property color_index: int | None
When operating in styled mode, a specific color index to use for the series, so that its graphic representations are given the class name
highcharts-color-{n}.Defaults to
None.
- property color_key: str | None
Determines what data value should be used to calculate point color if
FlowmapOptions.color_axis()is used.
- property colors: List[str | Gradient | Pattern] | None
A series-specific or series type-specific color set to apply instead of the global colors when
FlowmapOptions.color_by_point()isTrue.
- property cursor: str | None
The style of cursor to use when the user’s mouse hovers over the data series.
Acceptable values are:
'alias''all-scroll''auto''cell''col-resize''context-menu''copy''crosshair''default''e-resize''ew-resize''grab''grabbing''help''move''n-resize''ne-resize''nesw-resize''no-drop''none''not-allowed''ns-resize''nw-resize''nwse-resize''pointer''progress''row-resize''s-resize''se-resize''sw-resize''text''vertical-text''w-resize''wait''zoom-in''zoom-out'
- property curve_factor: int | float | Decimal | None
The amount by which to curve the lines on a flowmap. Higher numbers makes the links more curved, while a value of
0makes the lines straight. Defaults toNone.- Return type:
numeric or
None
- property custom: JavaScriptDict | None
A reserved subspace to store options and values for customized functionality.
Here you can add additional data for your own event callbacks and formatter callbacks.
- property dash_style: str | None
Name of the dash style to use for the graph, or for some series types the outline of each shape.
Accepts one of the following values:
‘Dash’,
‘DashDot’,
‘Dot’,
‘LongDash’,
‘LongDashDot’,
‘LongDashDotDot’,
‘ShortDash’,
‘ShortDashDot’,
‘ShortDashDotDot’,
‘ShortDot’,
‘Solid’
- property data_labels: DataLabel | List[DataLabel] | None
Options for the series data labels, appearing next to each data point.
Note
To have multiple data labels per data point, you can also supply a collection of
DataLabelconfiguration settings.
- property description: str | None
A description of the series to add to the screen reader information about the series.
- property enable_mouse_tracking: bool | None
If
True, enables mouse tracking for the series (used to capture point tooltips, click events on graphs and points, etc.). IfFalse, disables mouse tracking for the series (which can help performance). Defaults toTrue.
- property events: SeriesEvents | None
General event handlers for the series items.
Note
These event hooks can also be attached to the series at run time using the (JavaScript)
Highcharts.addEvent()function.- Return type:
SeriesEventsorNone
- property fill_color: str | Gradient | Pattern | EnforcedNullType | None
Fill color or gradient for the area. When
EnforcedNullType, the series’ color is used with the series’.fill_opacity.- Return type:
None,Gradient,Pattern, orEnforcedNullType
- property fill_opacity: int | float | Decimal | None
Fill opacity for the area. Defaults to
0.5.When you set an explicit
fill_color, thefill_opacityis not applied. Instead, you should define the opacity in thefill_colorwith an rgba color definition.The
fill_opacitysetting, also the default setting, overrides the alpha component of the color setting.- Return type:
numeric or
None
- property find_nearest_point_by: str | None
Determines whether the series should look for the nearest point in both dimensions or just the x-dimension when hovering the series.
If
None, defaults to'xy'for scatter series and'x'for most other series. If the data has duplicate x-values, it is recommended to set this to'xy'to allow hovering over all points.Applies only to series types using nearest neighbor search (not direct hover) for tooltip.
- property include_in_data_export: bool | None
If
False, will prevent the data series from being included in any form of data export. Defaults toTrue.
- property keys: List[str] | None
An array specifying which option maps to which key in the data point array.
This makes it convenient to work with unstructured data arrays from different sources.
- property label: SeriesLabel | None
Series labels are placed as close to the series as possible in a natural way, seeking to avoid other series. The goal of this feature is to make the chart more easily readable, like if a human designer placed the labels in the optimal position.
Note
The series labels currently work with series types having a graph or an area.
- Return type:
SeriesLabelorNone
- property legend_symbol: str | None
The type of legend symbol to render for the series. Accepts either
'lineMarker','areaMarker', or'rectangle'. Defaults to'rectangle'.- Return type:
- property line_width: int | float | Decimal | None
Pixel width of the graph line. Defaults to
None.- Return type:
numeric or
None
- property linked_to: str | None
The id of another series to link to.
Hint
The value can be
':previous'to link to the previous series. When two series are linked, only the first one appears in the legend. Toggling the visibility of this also toggles the linked series.Note
If the master series uses data sorting and linked series does not have its own sorting definition, the linked series will be sorted in the same order as the master one.
- property marker: Marker | None
Options for the point markers of line-like series.
Properties like
fill_color,line_colorandline_widthdefine the visual appearance of the markers. Other series types, like column series, don’t have markers, but have visual options on the series level instead.- Return type:
MarkerorNone
- property marker_end: FlowmapMarker | None
If enabled, creates an arrow symbol indicating the direction of the flow at the flow’s destination.
Warning
Setting/enabling this property in the
FlowmapOptionsobject rather than in theFlowmapSerieswill apply a marker to the end of every flowmap series in your visualization.- Return type:
FlowmapMarkeror :obj:`None <python:None>
- property max_width: int | float | Decimal | None
The maximum width of a link expressed in pixels. Defaults to
25.- Return type:
numeric or
None
- property min_width: int | float | Decimal | None
The minimum width of a link expressed in pixels. Defaults to
5.- Return type:
numeric or
None
- property null_color: str | Gradient | Pattern | None
The color applied to null points. Defaults to
'#f7f7f7'.
- property null_interaction: bool | None
If
True, allows pointer interactions (e.g. tooltips, mouse events, etc.) on null points. Defaults toNone.
- property on_point: OnPointOptions | None
Options for the Series on point feature, which is currently only supported by
pieandsunburstchargs.- Return type:
OnPointOptionsorNone
- property opacity: float | None
Opacity of a series parts: line, fill (e.g. area), and labels.
- Return type:
- property point_description_formatter: CallbackFunction | None
Same as for
Accessibility.series.description_formatter(), only for an individual series. Overrides the chart-wide configuration.- Return type:
CallbackFunctionorNone
- property selected: bool | None
If
True, the series is selected initially (by default, without user interaction). Defaults toFalse.Note
If
GenericTypeOptions.show_checkbox()isTrue, then the checkbox will be checked ifselectedisTrue.
- property show_checkbox: bool | None
If
True, a checkbox is displayed next to the legend item to allow selecting the series.Note
The state of the checkbox is controlled by the
GenericTypeOptions.selected()property.
- property show_in_legend: bool | None
Whether to display this particular series or series type in the legend. Standalone series are shown in the legend by default, and linked series are not.
If
True, the accessibility module will skip past this series when executing keyboard navigation.
- property sonification: SeriesSonification | None
Sonification configuration for the series type/series.
- Return type:
- property states: States | None
Configuration for state-specific configuration to apply to the data series.
- Return type:
StatesorNone
- property sticky_tracking: bool | None
Sticky tracking of mouse events.
When
True, the (JavaScript)mouseOutevent on a series is not triggered until the mouse moves over another series, or out of the plot area.When
False, the (JavaScript)mouseOutevent on a series is triggered when the mouse leaves the area around the series’ graph or markers. This also implies the tooltip when not shared.When
FalseandPlotOptions.tooltip.shared()is alsoFalse, the tooltip will be hidden when moving the mouse between series.Defaults to
Truefor line and area type series, but toFalsefor columns, pies, etc.Note
The boost module will force this option because of technical limitations.
- property threshold: int | float | Decimal | EnforcedNullType | None
The Y axis value to serve as the base for the columns, for distinguishing between values above and below a threshold. Defaults to
0.If
EnforcedNullType, the columns extend from the padding Y axis minimum.- Return type:
numeric or
EnforcedNullTypeorNone
- property tooltip: Tooltip | None
A configuration object for the tooltip rendering of each single series. Properties are inherited from tooltip, but only the following properties can be defined on a series level.
- Return type:
TooltiporNone
- property turbo_threshold: int | None
When a series contains a data array longer than this value, only one dimensional arrays of numbers, or two dimensional arrays with x and y values are allowed. Also, only the first point is tested, and the rest are assumed to be the same format. This saves expensive data checking and indexing in long series. Set it to
0orNoneto disable.Defaults to
1000.Note
In boost mode, turbo threshold is forced. Only array of numbers or two dimensional arrays are allowed.
- property type: str
Indicates the type of series that is represented by this instance.
Warning
This proprety is read-only!
- Return type:
- property visible: bool | None
If
True, the series is initially visible. IfFalse, the series is hidden by default. Defaults toTrue.
- property weight: int | float | Decimal | None
he weight for all links with unspecified weights. The weight of a link determines its thickness compared to other links. Defaults to
None.- Return type:
numeric or
None
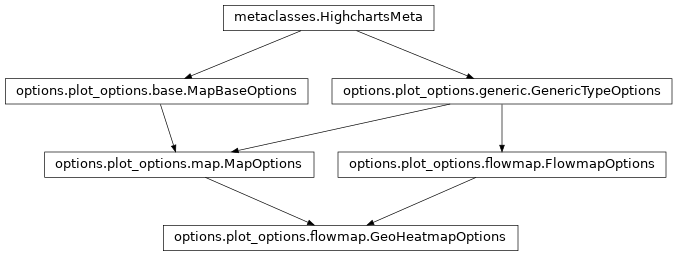
class: GeoHeatmapOptions
- class GeoHeatmapOptions(**kwargs)[source]
A geoheatmap series is a variety of heatmap series, composed into the map projection, where the units are expressed in latitude and longitude, while individual values contained in a matrix are represented as colors.
Warning
GeoHeatmaps require that
modules/geoheatmapis loaded client-side.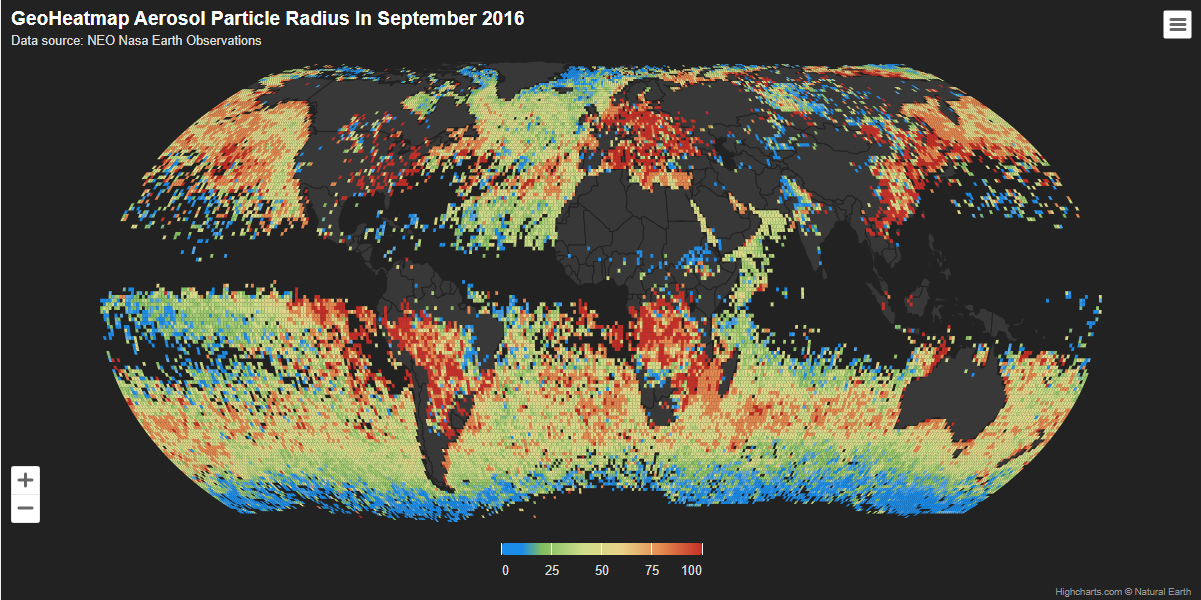
Class Inheritance
- copy(other=None, overwrite=True, **kwargs)
Copy the configuration settings from this instance to the
otherinstance.- Parameters:
other (
HighchartsMeta) – The target instance to which the properties of this instance should be copied. IfNone, will create a new instance and populate it with properties copied fromself. Defaults toNone.overwrite (
bool) – ifTrue, properties inotherthat are already set will be overwritten by their counterparts inself. Defaults toTrue.kwargs – Additional keyword arguments. Some special descendents of
HighchartsMetamay have special implementations of this method which rely on additional keyword arguments.
- Returns:
A mutated version of
otherwith new property values
- classmethod from_dict(as_dict: dict, allow_snake_case: bool = True)
Construct an instance of the class from a
dictobject.
- classmethod from_js_literal(as_str_or_file, allow_snake_case: bool = True, _break_loop_on_failure: bool = False)
Return a Python object representation of a Highcharts JavaScript object literal.
- Parameters:
as_str_or_file (
str) – The JavaScript object literal, represented either as astror as a filename which contains the JS object literal.allow_snake_case (
bool) – IfTrue, interpretssnake_casekeys as equivalent tocamelCasekeys. Defaults toTrue._break_loop_on_failure (
bool) – IfTrue, will break any looping operations in the event of a failure. Otherwise, will attempt to repair the failure. Defaults toFalse.
- Returns:
A Python object representation of the Highcharts JavaScript object literal.
- Return type:
HighchartsMeta
- classmethod from_json(as_json_or_file, allow_snake_case: bool = True)
Construct an instance of the class from a JSON string.
- Parameters:
as_json_or_file – The JSON string for the object or the filename of a file that contains the JSON string.
allow_snake_case (
bool) – IfTrue, interpretssnake_casekeys as equivalent tocamelCasekeys. Defaults toTrue.
- Returns:
A Python objcet representation of
as_json.- Return type:
HighchartsMeta
- get_required_modules(include_extension=False) List[str]
Return the list of URLs from which the Highcharts JavaScript modules needed to render the chart can be retrieved.
- to_dict() dict
Generate a
dictrepresentation of the object compatible with the Highcharts JavaScript library.Note
The
dictrepresentation has a property structure and naming convention that is intentionally consistent with the Highcharts JavaScript library. This is not Pythonic, but it makes managing the interplay between the two languages much, much simpler.
- to_js_literal(filename=None, encoding='utf-8', careful_validation=False) str | None
Return the object represented as a
strcontaining the JavaScript object literal.- Parameters:
along the way using the esprima-python library. Defaults to
False.Warning
Setting this value to
Truewill significantly degrade serialization performance, though it may prove useful for debugging purposes.
- to_json(filename=None, encoding='utf-8', for_export: bool = False)
Generate a JSON string/byte string representation of the object compatible with the Highcharts JavaScript library.
Note
This method will either return a standard
stror abytesobject depending on the JSON serialization library you are using. For example, if your environment has orjson, the result will be abytesrepresentation of the string.- Parameters:
filename (Path-like) – The name of a file to which the JSON string should be persisted. Defaults to
Noneencoding (
str) – The character encoding to apply to the resulting object. Defaults to'utf-8'.for_export (
bool) – IfTrue, indicates that the method is being run to produce a JSON for consumption by the export server. Defaults toFalse.
- Returns:
A JSON representation of the object compatible with the Highcharts library.
- Return type:
- static trim_dict(untrimmed: dict, to_json: bool = False, context: str = None, for_export: bool = False) dict
Remove keys from
untrimmedwhose values areNoneand convert values that have.to_dict()methods.- Parameters:
untrimmed (
dict) – Thedictwhose values may still beNoneor Python objects.to_json (
bool) – IfTrue, will remove all keys fromuntrimmedthat are not serializable to JSON. Defaults toFalse.context (
strorNone) – If provided, will inform the method of the context in which it is being run which may inform special handling cases (e.g. where empty strings may be important / allowable). Defaults toNone.for_export (
bool) – IfTrue, indicates that the method is being run to produce a JSON for consumption by the export server. Defaults toFalse.
- Returns:
Trimmed
dict- Return type:
- static trim_iterable(untrimmed, to_json=False, context: str = None, for_export: bool = False)
Convert any
EnforcedNullTypevalues inuntrimmedto'null'.- Parameters:
untrimmed (iterable) – The iterable whose members may still be
Noneor Python objects.to_json (
bool) – IfTrue, will remove all members fromuntrimmedthat are not serializable to JSON. Defaults toFalse.context (
strorNone) – If provided, will inform the method of the context in which it is being run which may inform special handling cases (e.g. where empty strings may be important / allowable). Defaults toNone.for_export (
bool) – IfTrue, indicates that the method is being run to produce a JSON for consumption by the export server. Defaults toFalse.
- Return type:
iterable
- property accessibility: TypeOptionsAccessibility | None
Accessibility options for a series.
- Return type:
TypeOptionsAccessibilityorNone
- property affects_map_view: bool | None
If
True, theMapViewtakes this series into account when computing the default zoom and center of the map. Defaults toTrue.
- property all_areas: bool | None
If
True, all areas defined in the map’s.map_datashould be rendered, with areas that do not have a related data point rendered as null values. IfFalse, areas of the map that do not have a related data point are skipped and not rendered. Defaults toTrue.
- property allow_point_select: bool | None
Allow this series’ points to be selected by clicking on the graphic (columns, point markers, pie slices, map areas etc).
The selected points can be handled in JavaScript by point select and unselect events, or collectively by the (JavaScript)
getSelectedPoints()function.And alternative way of selecting points is through dragging.
Defaults to
False.
- property animation: bool | AnimationOptions | None
Enable or disable the initial animation when a series is displayed.
The animation can also be set as a configuration object. Please note that this option only applies to the initial animation of the series itself. For other animations, see
Chart.animationand theanimationparameter under the (JavaScript) API methods. The following properties are supported:defer: The animation delay time in milliseconds.duration: The duration of the animation in milliseconds.easing: Can be a string reference to an easing function set on the Math object or a function.
Warning
Due to poor performance, animation is disabled in old IE browsers for several chart types.
- Return type:
AnimationOptionsorNone
- property animation_limit: int | float | Decimal | None
For some series, there is a limit that shuts down initial animation by default when the total number of points in the chart is too high. Defaults to
None.For example, for a column chart and its derivatives, animation does not run if there is more than 250 points totally. To disable this cap, set
animation_limittofloat("inf")(which represents infinity).- Return type:
numeric or
None
- property boost_threshold: int | None
Set the point threshold for when a series should enter boost mode. Defaults to
5000.Setting it to e.g. 2000 will cause the series to enter boost mode when there are 2,000 or more points in the series.
To disable boosting on the series, set the
boost_thresholdto0. Setting it to1will force boosting.Note
The
AreaOptions.crop_threshold()also affects this setting.When zooming in on a series that has fewer points than the
crop_threshold, all points are rendered although outside the visible plot area, and theboost_thresholdwon’t take effect.
- property border_color: str | Gradient | Pattern | None
The color of the border surrounding each area of the map. Defaults to
'#cccccc'.
- property border_width: int | float | Decimal | None
The width of the border surrounding each area of the map. Defaults to
1.- Return type:
numeric or
None
- property class_name: str | None
The additional CSS class name to apply to the series’ graphical elements.
Note
This option is additive to the default class names - it does not replace them.
- property clip: bool | None
If
False, allows the series to be rendered in the entire plot area. IfTrue, constrains where the series can be rendered within the plot area. Defaults toTrue.
- property color: str | Gradient | Pattern | None
The main color of the series.
In line type series it applies to the line and the point markers unless otherwise specified. In bar type series it applies to the bars unless a color is specified per point. The default value is pulled from the
Options.colors()array.
- property color_axis: str | int | bool | None
When using dual or multiple color axes, this setting defines which color axis the particular series is connected to. It refers to either the
ColorAxis.id()or the index of the axis in theColorAxisarray, with0being the first. Set this option toFalseto prevent a series from connecting to the default color axis.Defaults to
0.
- property color_by_point: bool | None
When using automatic point colors pulled from the global colors or series-specific collections, this option determines whether the chart should receive one color per series (
False) or one color per point (True).Defaults to
False.
- property color_index: int | None
When operating in styled mode, a specific color index to use for the series, so that its graphic representations are given the class name
highcharts-color-{n}.Defaults to
None.
- property color_key: str | None
Determines what data value should be used to calculate point color if
AreaOptions.color_axis()is used.Note
Requires to set
minandmaxif some custom point property is used or if approximation for data grouping is set to'sum'.
- property colors: List[str | Gradient | Pattern] | None
A series-specific or series type-specific color set to apply instead of the global colors when
FlowmapOptions.color_by_point()isTrue.
- property colsize: int | None
The column size - how many X axis units each column in the heatmap should span. Defaults to
1.
- property cursor: str | None
The style of cursor to use when the user’s mouse hovers over the data series.
Acceptable values are:
'alias''all-scroll''auto''cell''col-resize''context-menu''copy''crosshair''default''e-resize''ew-resize''grab''grabbing''help''move''n-resize''ne-resize''nesw-resize''no-drop''none''not-allowed''ns-resize''nw-resize''nwse-resize''pointer''progress''row-resize''s-resize''se-resize''sw-resize''text''vertical-text''w-resize''wait''zoom-in''zoom-out'
- property curve_factor: int | float | Decimal | None
The amount by which to curve the lines on a flowmap. Higher numbers makes the links more curved, while a value of
0makes the lines straight. Defaults toNone.- Return type:
numeric or
None
- property custom: JavaScriptDict | None
A reserved subspace to store options and values for customized functionality.
Here you can add additional data for your own event callbacks and formatter callbacks.
- property dash_style: str | None
Name of the dash style to use for the graph, or for some series types the outline of each shape.
Accepts one of the following values:
‘Dash’,
‘DashDot’,
‘Dot’,
‘LongDash’,
‘LongDashDot’,
‘LongDashDotDot’,
‘ShortDash’,
‘ShortDashDot’,
‘ShortDashDotDot’,
‘ShortDot’,
‘Solid’
- property data_as_columns: bool | None
If
True, indicates that the data is structured as columns instead of as rows. Defaults toNone, which behaves asFalse.
- property data_labels: DataLabel | List[DataLabel] | None
Options for the series data labels, appearing next to each data point.
Note
To have multiple data labels per data point, you can also supply a collection of
DataLabelconfiguration settings.
- property description: str | None
A description of the series to add to the screen reader information about the series.
- property drag_drop: DragDropOptions | None
The draggable-points module allows points to be moved around or modified in the chart.
In addition to the options mentioned under the dragDrop API structure, the module fires three (JavaScript) events:
point.dragStartpoint.dragpoint.drop
- Return type:
DragDropOptionsorNone
- property enable_mouse_tracking: bool | None
If
True, enables mouse tracking for the series (used to capture point tooltips, click events on graphs and points, etc.). IfFalse, disables mouse tracking for the series (which can help performance). Defaults toTrue.
- property events: SeriesEvents | None
General event handlers for the series items.
Note
These event hooks can also be attached to the series at run time using the (JavaScript)
Highcharts.addEvent()function.- Return type:
SeriesEventsorNone
- property fill_color: str | Gradient | Pattern | EnforcedNullType | None
Fill color or gradient for the area. When
EnforcedNullType, the series’ color is used with the series’.fill_opacity.- Return type:
None,Gradient,Pattern, orEnforcedNullType
- property fill_opacity: int | float | Decimal | None
Fill opacity for the area. Defaults to
0.5.When you set an explicit
fill_color, thefill_opacityis not applied. Instead, you should define the opacity in thefill_colorwith an rgba color definition.The
fill_opacitysetting, also the default setting, overrides the alpha component of the color setting.- Return type:
numeric or
None
- property find_nearest_point_by: str | None
Determines whether the series should look for the nearest point in both dimensions or just the x-dimension when hovering the series.
If
None, defaults to'xy'for scatter series and'x'for most other series. If the data has duplicate x-values, it is recommended to set this to'xy'to allow hovering over all points.Applies only to series types using nearest neighbor search (not direct hover) for tooltip.
- property include_in_data_export: bool | None
If
False, will prevent the data series from being included in any form of data export. Defaults toTrue.
- property interpolation: bool | InterpolationOptions | None
If enabled, render data points as an interpolated image. It can be used to show temperature map-like charts. Defaults to
False.- Return type:
boolorInterpolationOptionsorNone
- property join_by: str | List[str] | EnforcedNullType | None
The property which should be used to join the series’
.map_datato its.data. WhenNone, defaults to'hc-key'.Accepts three possible types of value:
a string, which joins on the same property in both the
.mapDataand.dataNote
For maps loaded from GeoJSON, the keys may be held in each point’s
propertiesobject.a 2-member collection, where the first represents the key in
.mapDataand the second represents a (different) key in.datahighcharts_maps.constants.EnforcedNull, where items are joined by their positions in the.mapDataand.dataarrays
Tip
Using
highcharts_maps.constants.EnforcedNullperforms much faster than the other two options. This is the recommended value when rendering more than a thousand data points, assuming that you are using a backend that can preprocess the data into parallel arrays.- Return type:
highcharts_maps.constants.EnforcedNullorstror 2-memberlistofstr, orNone- Raises:
HighchartsValueError – if supplied an iterable that has more than 2 members
- property keys: List[str] | None
An array specifying which option maps to which key in the data point array.
This makes it convenient to work with unstructured data arrays from different sources.
- property label: SeriesLabel | None
Series labels are placed as close to the series as possible in a natural way, seeking to avoid other series. The goal of this feature is to make the chart more easily readable, like if a human designer placed the labels in the optimal position.
Note
The series labels currently work with series types having a graph or an area.
- Return type:
SeriesLabelorNone
- property legend_symbol: str | None
The type of legend symbol to render for the series. Accepts either
'lineMarker','areaMarker', or'rectangle'. Defaults to'rectangle'.- Return type:
- property line_width: int | float | Decimal | None
Pixel width of the graph line. Defaults to
None.- Return type:
numeric or
None
- property linked_to: str | None
The id of another series to link to.
Hint
The value can be
':previous'to link to the previous series. When two series are linked, only the first one appears in the legend. Toggling the visibility of this also toggles the linked series.Note
If the master series uses data sorting and linked series does not have its own sorting definition, the linked series will be sorted in the same order as the master one.
- property marker: Marker | None
Options for the point markers of line-like series.
Properties like
fill_color,line_colorandline_widthdefine the visual appearance of the markers. Other series types, like column series, don’t have markers, but have visual options on the series level instead.- Return type:
MarkerorNone
- property marker_end: FlowmapMarker | None
If enabled, creates an arrow symbol indicating the direction of the flow at the flow’s destination.
Warning
Setting/enabling this property in the
FlowmapOptionsobject rather than in theFlowmapSerieswill apply a marker to the end of every flowmap series in your visualization.- Return type:
FlowmapMarkeror :obj:`None <python:None>
- property max_width: int | float | Decimal | None
The maximum width of a link expressed in pixels. Defaults to
25.- Return type:
numeric or
None
- property min_width: int | float | Decimal | None
The minimum width of a link expressed in pixels. Defaults to
5.- Return type:
numeric or
None
- property negative_color: str | Gradient | Pattern | None
The color for the parts of the graph or points that are below the
AreaOptions.threshold().Note
Zonestake precedence over the negative color. Usingnegative_coloris equivalent to applying a zone with value of 0.
- property null_color: str | Gradient | Pattern | None
The color to apply to null data points. Defaults to
'#f7f7f7'.
- property null_interaction: bool | None
If
True, allows pointer interactions (e.g. tooltips, mouse events, etc.) on null data points in the series. Defaults toNone.
- property on_point: OnPointOptions | None
Options for the Series on point feature, which is currently only supported by
pieandsunburstchargs.- Return type:
OnPointOptionsorNone
- property opacity: float | None
Opacity of a series parts: line, fill (e.g. area), and labels.
- Return type:
- property point_description_formatter: CallbackFunction | None
Same as for
Accessibility.series.description_formatter(), only for an individual series. Overrides the chart-wide configuration.- Return type:
CallbackFunctionorNone
- property rowsize: int | None
The row size - how many Y axis units each heatmap row should span. Defaults to
1.
- property selected: bool | None
If
True, the series is selected initially (by default, without user interaction). Defaults toFalse.Note
If
GenericTypeOptions.show_checkbox()isTrue, then the checkbox will be checked ifselectedisTrue.
- property show_checkbox: bool | None
If
True, a checkbox is displayed next to the legend item to allow selecting the series.Note
The state of the checkbox is controlled by the
GenericTypeOptions.selected()property.
- property show_in_legend: bool | None
Whether to display this particular series or series type in the legend. Standalone series are shown in the legend by default, and linked series are not.
If
True, the accessibility module will skip past this series when executing keyboard navigation.
- property sonification: SeriesSonification | None
Sonification configuration for the series type/series.
- Return type:
- property states: States | None
Configuration for state-specific configuration to apply to the data series.
- Return type:
StatesorNone
- property sticky_tracking: bool | None
Sticky tracking of mouse events.
When
True, the (JavaScript)mouseOutevent on a series is not triggered until the mouse moves over another series, or out of the plot area.When
False, the (JavaScript)mouseOutevent on a series is triggered when the mouse leaves the area around the series’ graph or markers. This also implies the tooltip when not shared.When
FalseandPlotOptions.tooltip.shared()is alsoFalse, the tooltip will be hidden when moving the mouse between series.Defaults to
Truefor line and area type series, but toFalsefor columns, pies, etc.Note
The boost module will force this option because of technical limitations.
- property threshold: int | float | Decimal | EnforcedNullType | None
The Y axis value to serve as the base for the columns, for distinguishing between values above and below a threshold. Defaults to
0.If
EnforcedNullType, the columns extend from the padding Y axis minimum.- Return type:
numeric or
EnforcedNullTypeorNone
- property tooltip: Tooltip | None
A configuration object for the tooltip rendering of each single series. Properties are inherited from tooltip, but only the following properties can be defined on a series level.
- Return type:
TooltiporNone
- property turbo_threshold: int | None
When a series contains a data array longer than this value, only one dimensional arrays of numbers, or two dimensional arrays with x and y values are allowed. Also, only the first point is tested, and the rest are assumed to be the same format. This saves expensive data checking and indexing in long series. Set it to
0orNoneto disable.Defaults to
1000.Note
In boost mode, turbo threshold is forced. Only array of numbers or two dimensional arrays are allowed.
- property type: str
Indicates the type of series that is represented by this instance.
Warning
This proprety is read-only!
- Return type:
- property visible: bool | None
If
True, the series is initially visible. IfFalse, the series is hidden by default. Defaults toTrue.
- property weight: int | float | Decimal | None
he weight for all links with unspecified weights. The weight of a link determines its thickness compared to other links. Defaults to
None.- Return type:
numeric or
None
class: InterpolationOptions
- class InterpolationOptions(**kwargs)[source]
Options to configure map interpolation.
Class Inheritance
- copy(other=None, overwrite=True, **kwargs)
Copy the configuration settings from this instance to the
otherinstance.- Parameters:
other (
HighchartsMeta) – The target instance to which the properties of this instance should be copied. IfNone, will create a new instance and populate it with properties copied fromself. Defaults toNone.overwrite (
bool) – ifTrue, properties inotherthat are already set will be overwritten by their counterparts inself. Defaults toTrue.kwargs – Additional keyword arguments. Some special descendents of
HighchartsMetamay have special implementations of this method which rely on additional keyword arguments.
- Returns:
A mutated version of
otherwith new property values
- classmethod from_dict(as_dict: dict, allow_snake_case: bool = True)
Construct an instance of the class from a
dictobject.
- classmethod from_js_literal(as_str_or_file, allow_snake_case: bool = True, _break_loop_on_failure: bool = False)
Return a Python object representation of a Highcharts JavaScript object literal.
- Parameters:
as_str_or_file (
str) – The JavaScript object literal, represented either as astror as a filename which contains the JS object literal.allow_snake_case (
bool) – IfTrue, interpretssnake_casekeys as equivalent tocamelCasekeys. Defaults toTrue._break_loop_on_failure (
bool) – IfTrue, will break any looping operations in the event of a failure. Otherwise, will attempt to repair the failure. Defaults toFalse.
- Returns:
A Python object representation of the Highcharts JavaScript object literal.
- Return type:
HighchartsMeta
- classmethod from_json(as_json_or_file, allow_snake_case: bool = True)
Construct an instance of the class from a JSON string.
- Parameters:
as_json_or_file – The JSON string for the object or the filename of a file that contains the JSON string.
allow_snake_case (
bool) – IfTrue, interpretssnake_casekeys as equivalent tocamelCasekeys. Defaults toTrue.
- Returns:
A Python objcet representation of
as_json.- Return type:
HighchartsMeta
- get_required_modules(include_extension=False) List[str]
Return the list of URLs from which the Highcharts JavaScript modules needed to render the chart can be retrieved.
- to_dict() dict
Generate a
dictrepresentation of the object compatible with the Highcharts JavaScript library.Note
The
dictrepresentation has a property structure and naming convention that is intentionally consistent with the Highcharts JavaScript library. This is not Pythonic, but it makes managing the interplay between the two languages much, much simpler.
- to_js_literal(filename=None, encoding='utf-8', careful_validation=False) str | None
Return the object represented as a
strcontaining the JavaScript object literal.- Parameters:
along the way using the esprima-python library. Defaults to
False.Warning
Setting this value to
Truewill significantly degrade serialization performance, though it may prove useful for debugging purposes.
- to_json(filename=None, encoding='utf-8', for_export: bool = False)
Generate a JSON string/byte string representation of the object compatible with the Highcharts JavaScript library.
Note
This method will either return a standard
stror abytesobject depending on the JSON serialization library you are using. For example, if your environment has orjson, the result will be abytesrepresentation of the string.- Parameters:
filename (Path-like) – The name of a file to which the JSON string should be persisted. Defaults to
Noneencoding (
str) – The character encoding to apply to the resulting object. Defaults to'utf-8'.for_export (
bool) – IfTrue, indicates that the method is being run to produce a JSON for consumption by the export server. Defaults toFalse.
- Returns:
A JSON representation of the object compatible with the Highcharts library.
- Return type:
- static trim_dict(untrimmed: dict, to_json: bool = False, context: str = None, for_export: bool = False) dict
Remove keys from
untrimmedwhose values areNoneand convert values that have.to_dict()methods.- Parameters:
untrimmed (
dict) – Thedictwhose values may still beNoneor Python objects.to_json (
bool) – IfTrue, will remove all keys fromuntrimmedthat are not serializable to JSON. Defaults toFalse.context (
strorNone) – If provided, will inform the method of the context in which it is being run which may inform special handling cases (e.g. where empty strings may be important / allowable). Defaults toNone.for_export (
bool) – IfTrue, indicates that the method is being run to produce a JSON for consumption by the export server. Defaults toFalse.
- Returns:
Trimmed
dict- Return type:
- static trim_iterable(untrimmed, to_json=False, context: str = None, for_export: bool = False)
Convert any
EnforcedNullTypevalues inuntrimmedto'null'.- Parameters:
untrimmed (iterable) – The iterable whose members may still be
Noneor Python objects.to_json (
bool) – IfTrue, will remove all members fromuntrimmedthat are not serializable to JSON. Defaults toFalse.context (
strorNone) – If provided, will inform the method of the context in which it is being run which may inform special handling cases (e.g. where empty strings may be important / allowable). Defaults toNone.for_export (
bool) – IfTrue, indicates that the method is being run to produce a JSON for consumption by the export server. Defaults toFalse.
- Return type:
iterable
- property blur: int | float | Decimal | None
- Represents how much blur should be added to the interpolated
image. Defaults to
1.Tip
Works best in the range of
0 - 1, all higher values would need higher perfomance to calculate more detailed interpolation.Note
This is useful, if the data is spread into wide range of
- longitue and
latitude values.
- rtype:
numeric or
None